B. PH Electronics Exports: (Year-on-Year)
The Philippine Electronics exports went down by 1.05%, from US$ 3.91 billion in March 2023 to US$ 3.87 billion in March 2024, as shown in Fig. 2.
Exports in four (4) sectors contracted, led by Office Equipment at 23.00%, from US$ 29.07 million to US$ 22.38 million. This was followed by Telecommunication (12.78%), Communication/Radar (10.30%), and Semiconductor Components/Devices (0.18%).
Automotive Electronics rose by 65.10%, from US$ 3.07 million to US$ 5.07 million. It was followed by Medical/Industrial Instrumentation (54.02%), Electronic Data Processing (8.92%), Control and Instrumentation (3.59%), and Consumer Electronics (2.93%). Kindly refer to Table 2.
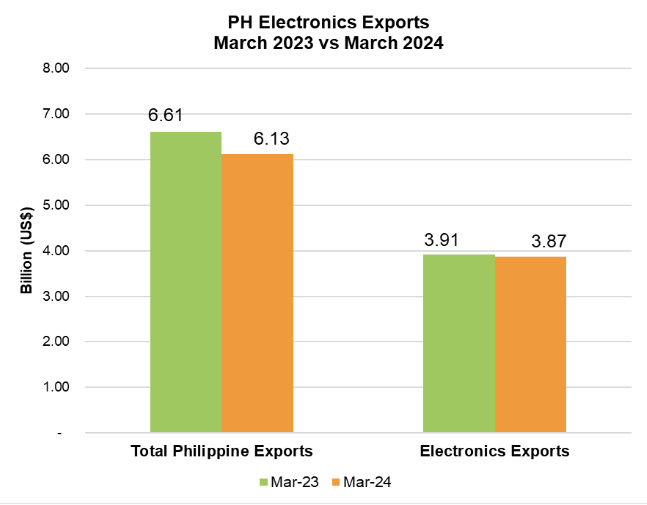
Fig. 2: PH Electronics Exports (March 2023 vs March 2024)
C. PH Electronics Exports (Year-to-Date)
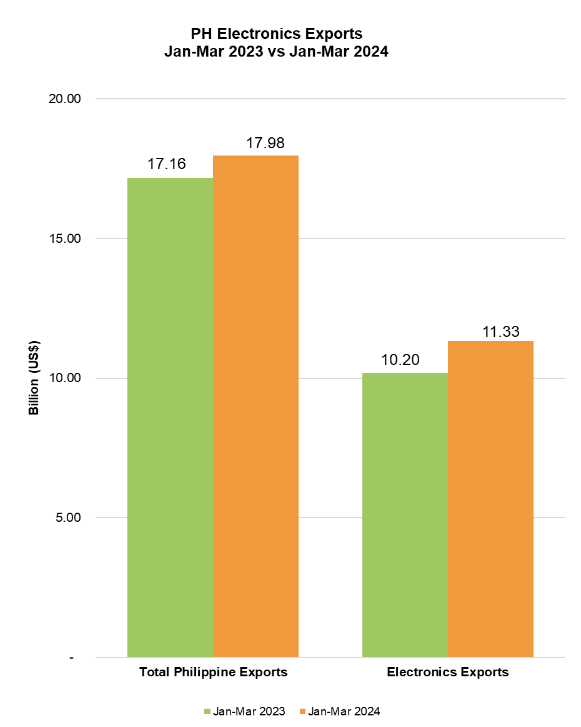
Fig. 3: PH Electronics Exports (January – March 2023 vs. January – March 2024)
Table 1 shows the top five (5) export destinations in March 2024, namely, Hong Kong (20.43%), the USA (13.76%), China (10.82%), Japan (6.58%), and Singapore (5.74%). These were likewise the countries of destination in the same order in February 2024.
Table 1 shows the top five (5) export destinations in March 2024, namely, Hong Kong (20.43%), the USA (13.76%), China (10.82%), Japan (6.58%), and Singapore (5.74%). These were likewise the countries of destination in the same order in February 2024.
Table 1: Top 5 Destination Countries for Electronics
(February 2024 vs March 2024)
The other destinations in the top ten were Taiwan (5.07%), South Korea (4.48%), Germany (4.25%), the Netherlands (4.13%), and Vietnam (3.57%).
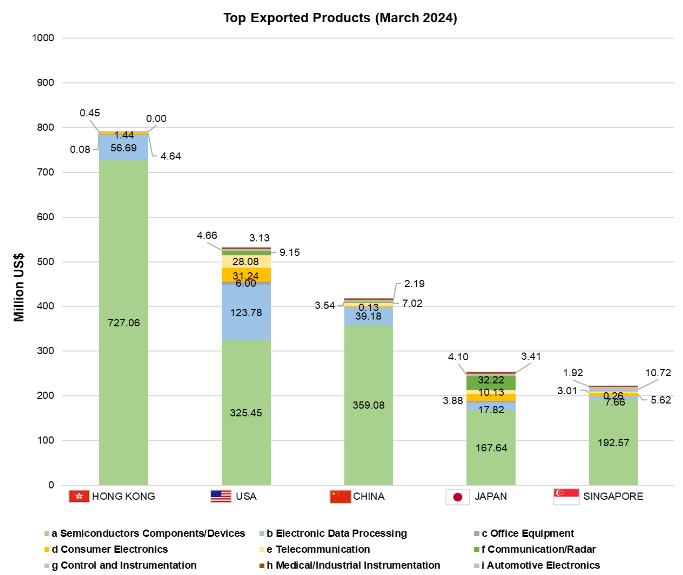
Fig. 4: Top Exported Products, March 2024
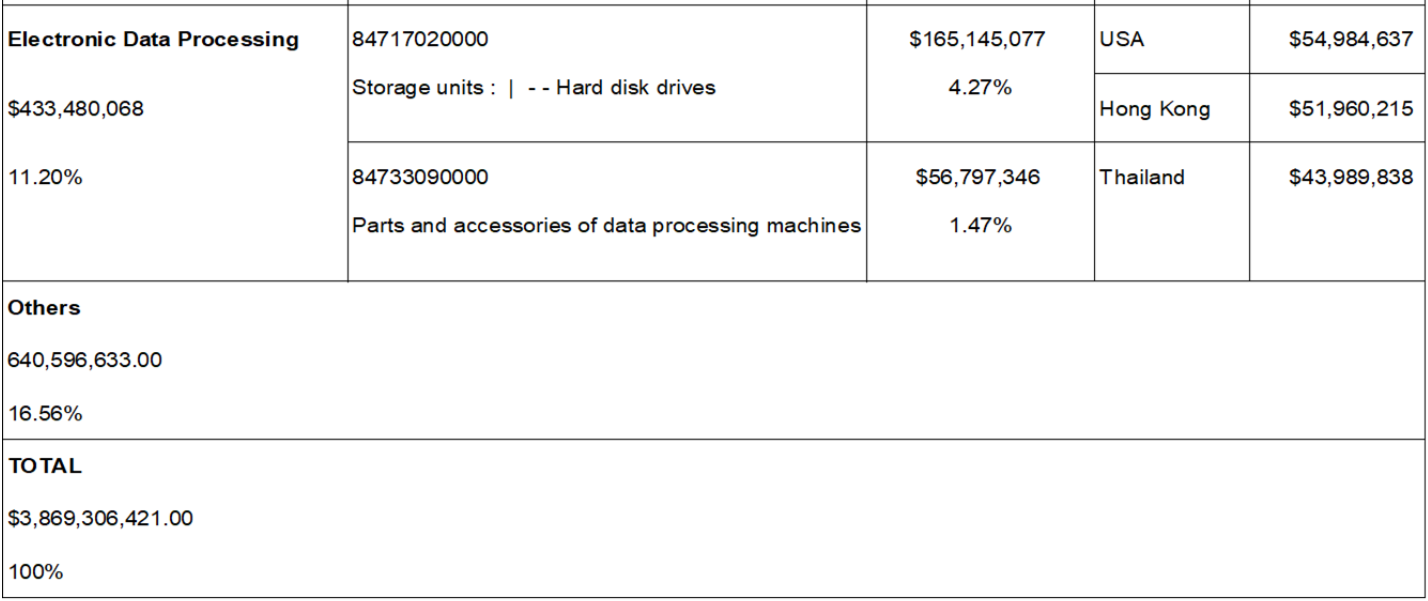
The top exported electronics products in March 2024 are in Fig. 4. Processors and controllers under Electronic Data Processing bound for Hong Kong rose by 40.84%. Meanwhile, Multi-component Integrated Circuits bound for the USA shrunk by 38.68%. See Table 4.
Table 2: PH Electronics Exports Product by Sector (Month-on-Month and Year-on-Year)
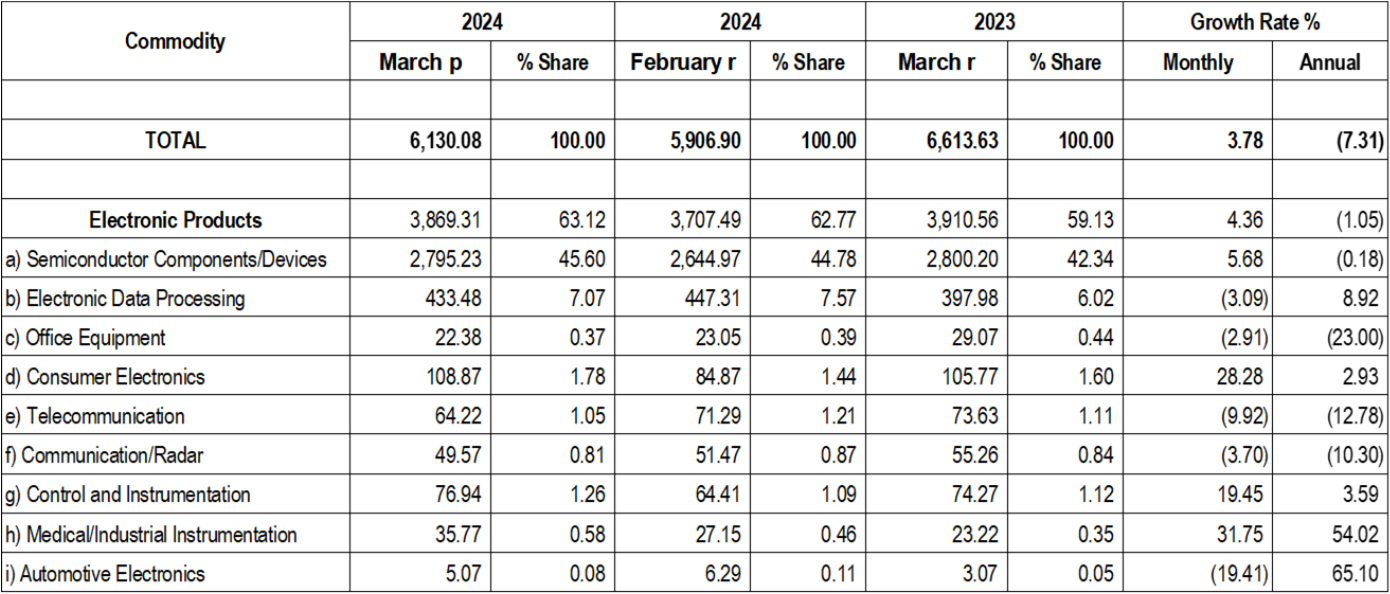
Table 3: PH Top Electronics Export Products by Sector (Year-to-date)
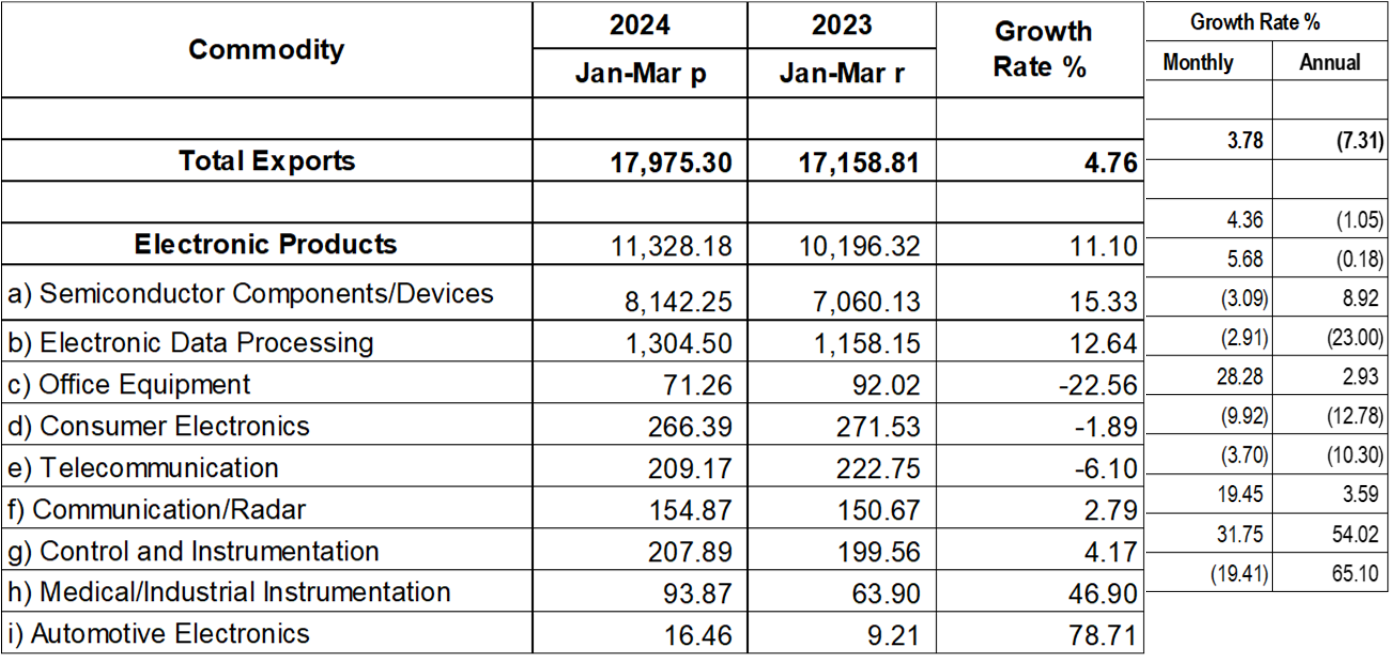
Table 4: PH Top Electronics Export Products and Countries of Destination