Electronics imports in September 2025 increased by 9.22% from US$ 2.79 billion in August 2025 to US$ 3.05 billion, which is 26.26% of the country’s US$ 11.60 billion total commodity imports.
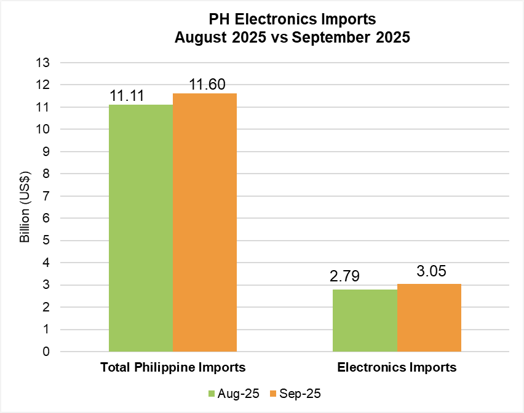
Fig. 1: PH Electronics Imports (August 2025 vs September 2025)
The country’s electronics imports rose by 9.22% from US$ 2.79 billion in August 2025 to US$ 3.05 billion in September 2025. See Fig. 1.
Four (4) electronics sectors went up, led by Communication/Radar at 177.93%, from US$ 149.08 million to US$ 414.34 million. It was followed by Medical/Industrial Instrumentation (34.19%), Consumer Electronics (11.72%), and Electronic Data Processing (10.20%).
Meanwhile, Automotive Electronics contracted by 27.28%, from US$ 6.38 million to US$ 4.64 million. It was followed by Telecommunication (23.25%), Office Equipment (15.93%), Control and Instrumentation (5.28%), and Semiconductor Components/Devices (0.99%).
The electronics imports climbed by 26.42%, from US$ 2.41 billion in September 2024 to US$ 3.05 billion in September 2025, as shown in Fig. 2.
Six (6) sectors increased, which was led by Communication/Radar at 285.97%, from US$ 107.35 million to US$ 414.34 million, as shown in Table 2. It was followed by Medical/Industrial Instrumentation (37.09%), Control and Instrumentation (28.19%), Semiconductor Components/Devices (18.49%), and Electronic Data Processing (9.90%).
Four (4) sectors declined, namely, Telecommunication (22.58%), Office Equipment (5.63%), Automotive Electronics (5.20%), and Consumer Electronics (2.74%).
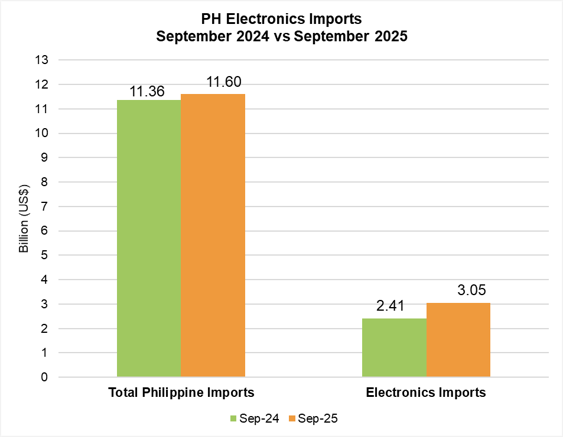
Fig. 2: PH Electronics Imports (September 2024 vs September 2025)
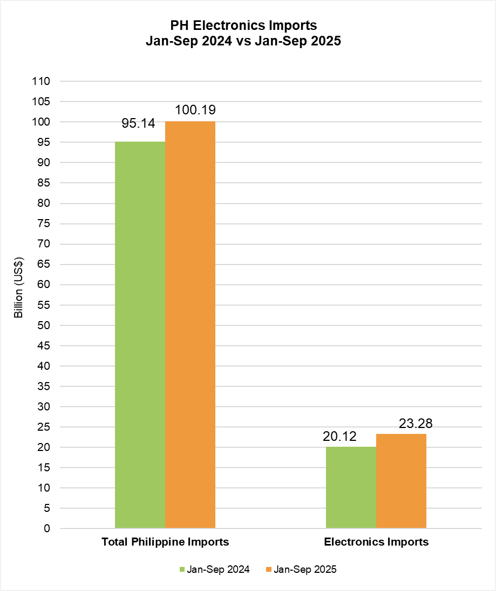
Fig. 3: PH Electronics Imports (January – September 2024 vs. January – September 2025)
Cumulative electronics imports grew by 15.74%, from US$ 20.12 billion in 2024 to US$ 23.28 billion in 2025. These comprised 23.24% of the total Philippine commodity imports YTD (See Fig. 3).
Eight (8) electronics sectors went up, led by Communication/Radar at 29.36%, from US$ 1.04 billion to US$ 1.34 billion. This was followed by Semiconductor Components/Devices (17.00%), Electronic Data Processing (12.49%), Medical/Industrial Instrumentation (12.23%), Control and Instrumentation (11.23%), Consumer Electronics (10.14%), Automotive Electronics (8.97%), and Telecommunication (5.26%). Kindly refer to Table 3.
Meanwhile, Office Equipment contracted by 3.86%, from US$ 157.73 million to US$ 151.63 million.
COUNTRIES OF ORIGIN (SEPTEMBER 2025)
Table 1 shows that the top five (5) countries of origin of electronics imports in September 2025 were China (29.02%), South Korea (11.46%), Vietnam (10.21%), Taiwan (9.37%), and Japan (8.44%).
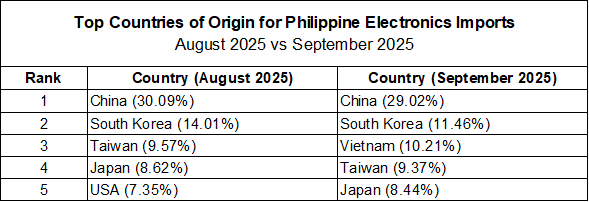
Table 1: Top 5 Countries of Origin for Electronics Imports (August 2025 vs September 2025)
The rest of the top ten countries of origin were the USA (6.90%), Singapore (6.68%), Malaysia (4.41%), Hong Kong (3.62%), and Thailand (2.95%).
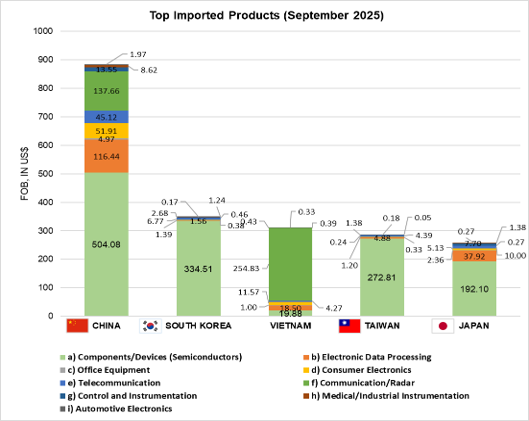
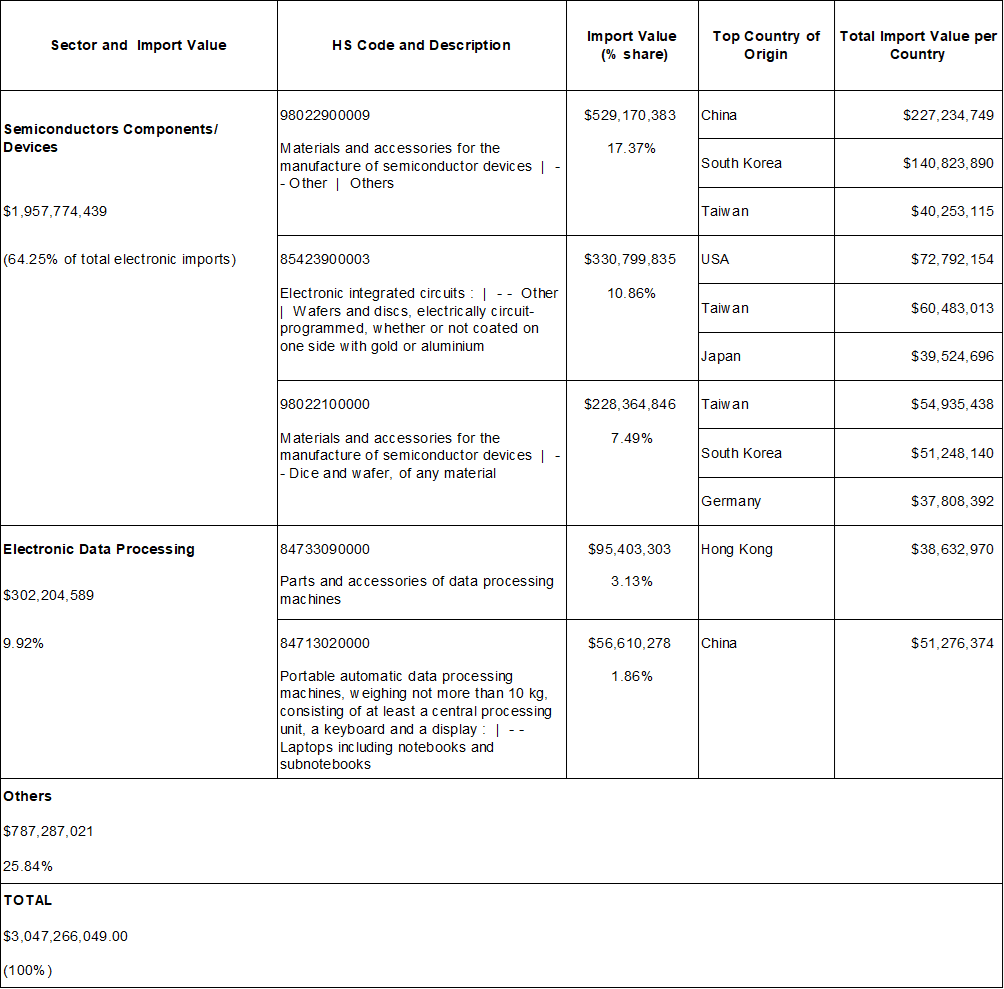
Fig. 4: Top Imported Products (September 2025)
Fig. 4 shows the top imported electronics products in September 2025. Laptops including notebooks and subnotebooks under Electronic Data Processing imported from China increased by 49.21%. Meanwhile, Parts and accessories of data processing machines imported from Hong Kong declined by 37.50%. See Table 4.
Table 2: PH Electronics Imports Product by Sector (Month-on-Month and Year-on-Year)
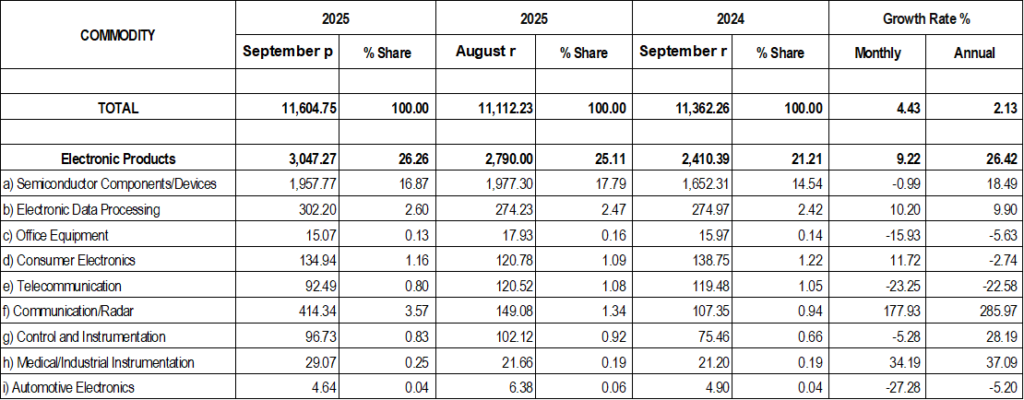
Table 3: PH Electronics Imports Product by Sector (Year-to-date)
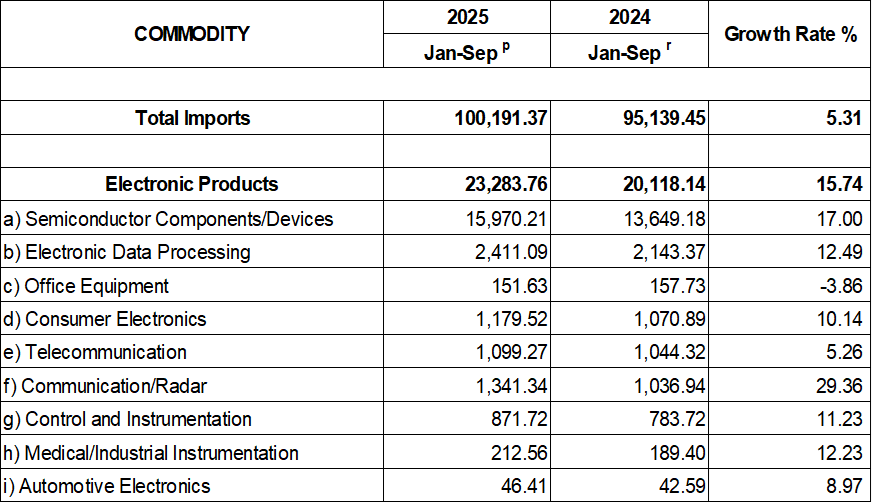
Table 4: PH Top Electronics Import Products and Countries of Destination