Electronics imports in March 2024 rose by 4.66% to US$ 2.01 billion, which is 21.62% of the country’s US$ 9.31 billion total commodity imports.
A.PH Electronics Imports: (Month-on-Month)
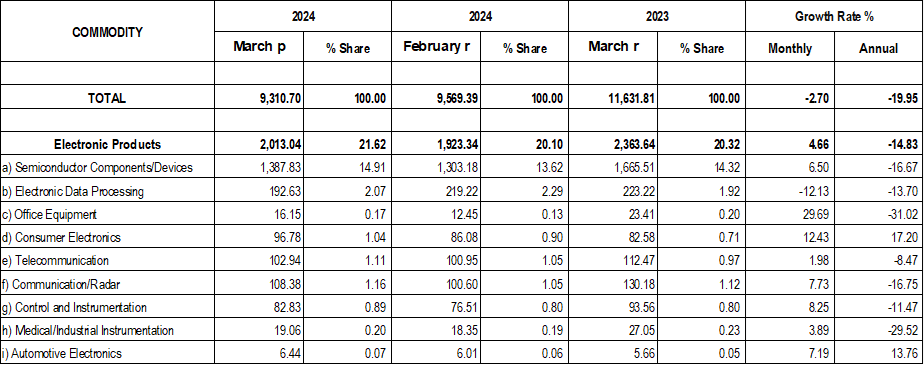
Fig. 1: PH Electronics Imports (February 2024 vs March 2024)
The country’s electronics imports increased from US$ 1.92 billion in February 2024 to US$ 2.01 billion in March 2024. See Fig. 1.
Eight (8) sectors went up, led by Office Equipment at 29.69%, from US$ 12.45 million to US$ 16.15 million. This was followed by Consumer Electronics (12.43%), Control and Instrumentation (8.25%), Communication/Radar (7.73%), Automotive Electronics (7.19%), Semiconductor Components/Devices (6.50%), Medical/Industrial Instrumentation (3.89%), and Telecommunication (1.98%)
Electronic Data Processing declined by 12.13%, from US$ 219.22 million to US$ 192.63 million.
B. PH
Electronics Imports: (Year-on-Year)
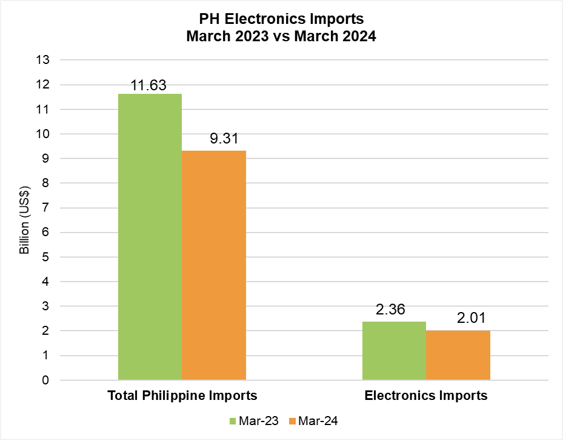
The electronics imports shrunk by 14.83%, from US$ 2.36 billion in March 2023 to US$ 2.01 billion in March 2024, as shown in Fig. 2.
Imports for seven (7) sectors contracted, led by Office Equipment at 31.02%, from US$ 23.41 million to US$ 16.15 million, as shown in Table 2. It was followed by Medical/Industrial Instrumentation (29.52%), Communication/Radar (16.75%), Semiconductor Components/Devices (16.67%), Electronic Data Processing (13.70%), Control and Instrumentation (11.47%), and Telecommunication (8.47%).
Meanwhile, Consumer Electronics rose by 17.20%, from US$ 82.58 million to US$ 96.78 million. This was followed by Automotive Electronics (13.76%).
Fig. 2: PH Electronics Imports (March 2023 vs March 2024)
C. PH Electronics Imports (Year-to-Date)
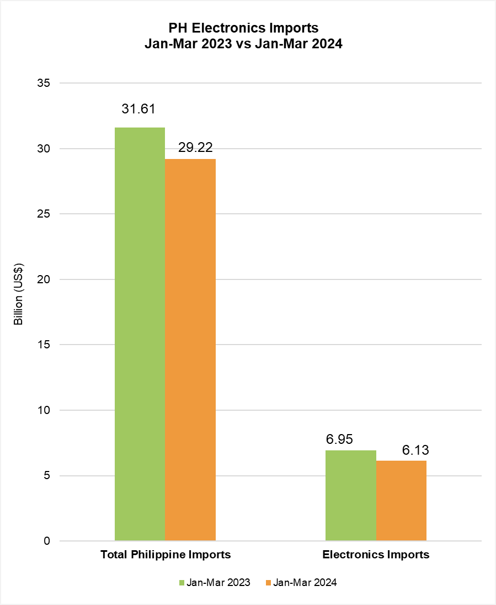
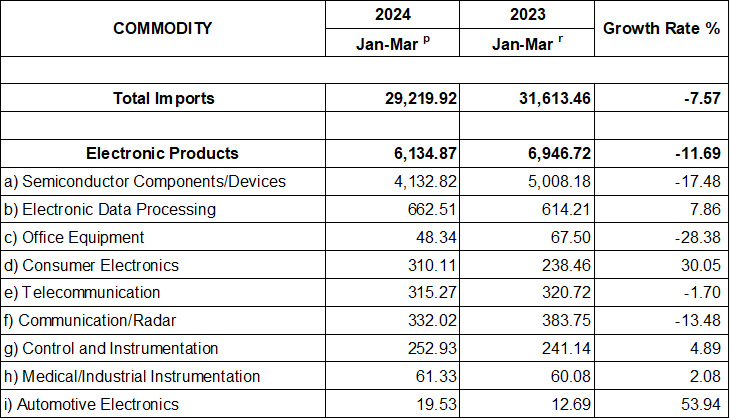
Fig. 3: PH Electronics Imports (January – March 2023 vs. January – March 2024)
Cumulative electronics imports decreased by 11.69%, from US$ 6.95 billion in 2023 to US$ 6.13 billion in 2024. These comprised 21.00% of the total Philippine commodity imports YTD (See Fig. 3.).
Four (4) electronics sectors went down, led by Office Equipment (28.38%) from US$ 67.50 million to US$ 48.34 million. It was followed by Semiconductor Components/Devices (17.48%), Communication/Radar (13.48%), and Telecommunication (1.70%).
Five (5) sectors increased, namely, Automotive Electronics (53.94%), Consumer Electronics (30.05%), Electronic Data Processing (7.86%), Control and Instrumentation (4.89%), and Medical/Industrial Instrumentation (2.08%). Kindly refer to Table 3.
COUNTRIES OF ORIGIN (FEBRUARY 2024)
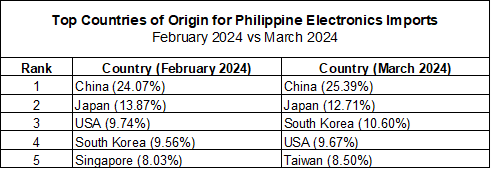
Table 1 shows that the top five (5) countries of origin of electronics imports in March 2024 were China (25.39%), Japan (12.71%), South Korea (10.60%), the USA (9.67%), and Taiwan (8.50%).
Table 1: Top 5 Countries of Origin for Electronics Imports (February 2024 vs March 2024)
The rest of the top ten countries of origin were Singapore (7.09%), Malaysia (5.07%), Hong Kong (4.95%), Vietnam (3.59%), and Thailand (3.35%).
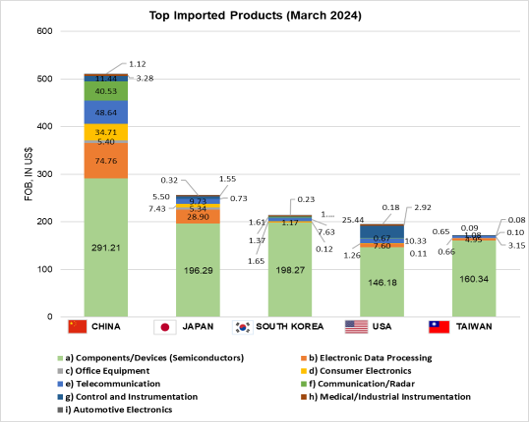
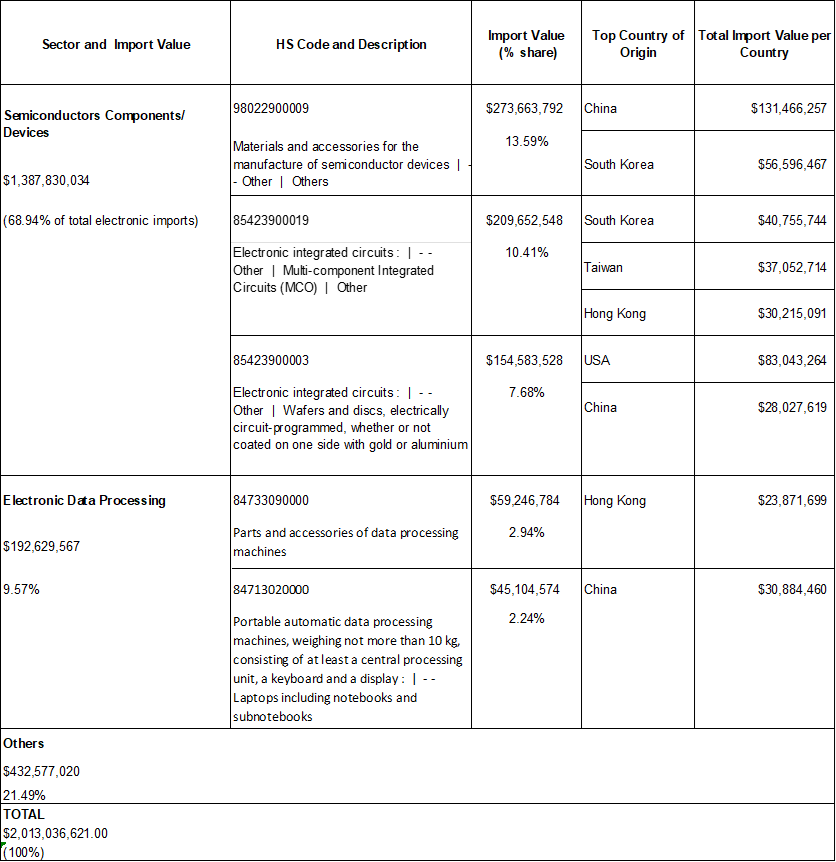
Fig. 4: Top Imported Products (March 2024)
Fig. 4 shows the top imported electronics products in March 2024. Laptops including notebooks and subnotebooks under Electronic Data Processing imported from China went up by 47.08%. Meanwhile, parts and accessories of data processing machines under Electronic Data Processing imported from Hong Kong declined by 68.80%. See Table 3.
Table 2: PH Electronics Imports Product by Sector (Month-on-Month and Year-on-Year)
Table 3: PH Electronics Imports Product by Sector (Year-to-date)
Table 4: PH Top Electronics Import Products and Countries of Destination