PHILIPPINE ELECTRONICS IMPORT PERFORMANCE DECEMBER 2025
Electronics imports in December 2025 declined by 9.76% from US$ 2.95 billion in November 2025 to US$ 2.66 billion, which is 25.28% of the country’s US$ 10.52 billion total commodity imports.
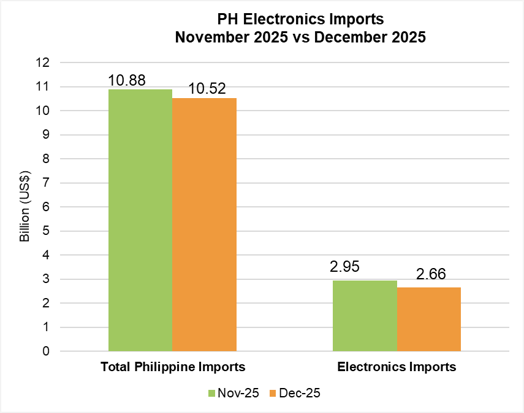
Fig. 1: PH Electronics Imports (November 2025 vs December 2025)
The country’s electronics imports contracted by 9.76% from US$ 2.95 billion in November 2025 to US$ 2.66 billion in December 2025. See Fig. 1.
Seven (7) electronics sectors shrunk, led by Communication/Radar at 28.96%, from US$ 178.86 million to US$ 127.06 million. This was followed by Office Equipment (27.82%), Consumer Electronics (16.44%), Electronic Data Processing (14.46%), Semiconductor Components/Devices (8.25%), Medical/Industrial Instrumentation (6.09%), and Control and Instrumentation (4.38%).
Telecommunication increased by 6.50%, from US$ 125.73 million to US$ 133.91 million. It was followed by Automotive Electronics (5.03%).
The electronics imports climbed by 25.77%, from US$ 2.11 billion in December 2024 to US$ 2.66 billion in December 2025, as shown in Fig. 2.
Seven (7) sectors went up, which was led by Semiconductor Components/Devices at 31.72%, from US$ 1.45 billion to US$ 1.91 million, as shown in Table 2. It was followed by Communication/Radar (21.16%), Telecommunication (19.94%), Control and Instrumentation (17.13%), Consumer Electronics (13.41%), Automotive Electronics (12.46%), and Electronic Data Processing (7.29%).
Meanwhile, two (2) sectors went down, namely, Office Equipment (11.19%), and Medical/Industrial Instrumentation (9.53%).
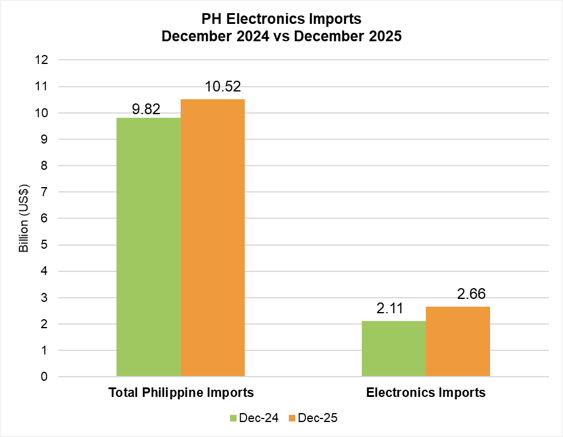
Fig. 2: PH Electronics Imports (December 2024 vs December 2025)
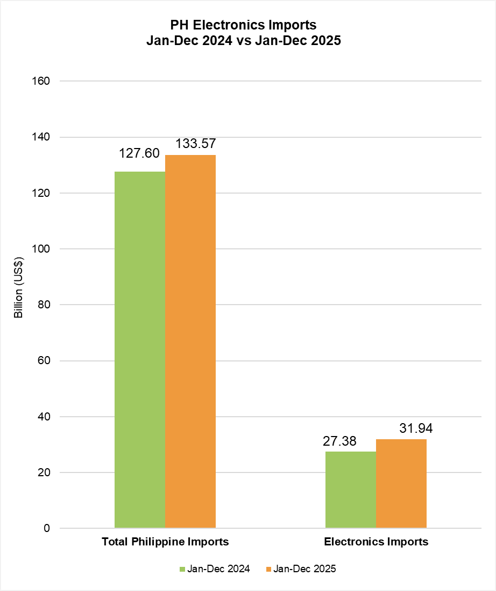
Fig. 3: PH Electronics Imports (January – December 2024 vs. January – December 2025)
Cumulative electronics imports increased by 16.67%, from US$ 27.38 billion in 2024 to US$ 31.94 billion in 2025. These comprised 23.92% of the total Philippine commodity imports YTD (See Fig. 3).
Imports in all sectors grew, led by Semiconductor Components/Devices at 20.07%, from US$ 18.50 billion to US$ 22.22 billion. It was followed by Communication/Radar (16.62%), Control and Instrumentation (14.53%), Electronic Data Processing (11.30%), Medical/Industrial Instrumentation (9.29%), Automotive Electronics (7.65%), Consumer Electronics (3.19%), Telecommunication (2.70%), and Office Equipment (2.17%). Kindly refer to Table 3.
COUNTRIES OF ORIGIN (DECEMBER 2025)
Table 1 shows that the top five (5) countries of origin of electronics imports in December 2025 were China (28.97%), South Korea (19.85%), Taiwan (9.84%), the USA (8.27%), and Japan (8.19%).
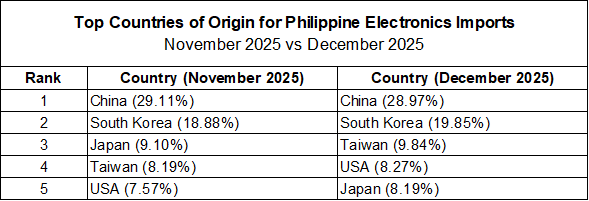
Table 1: Top 5 Countries of Origin for Electronics Imports (November 2025 vs December 2025)
The rest of the top ten countries of origin were Singapore (6.16%), Malaysia (4.44%), Hong Kong (3.30%), Thailand (2.41%), and Vietnam (1.98%).
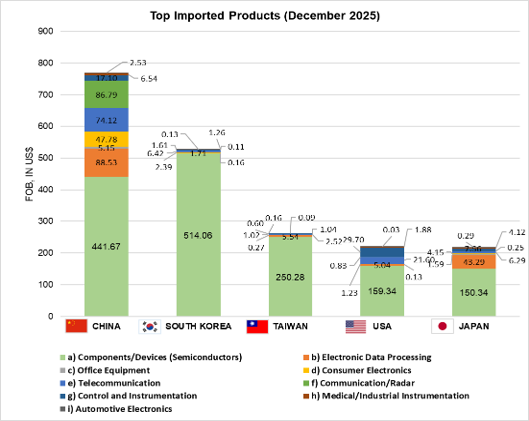
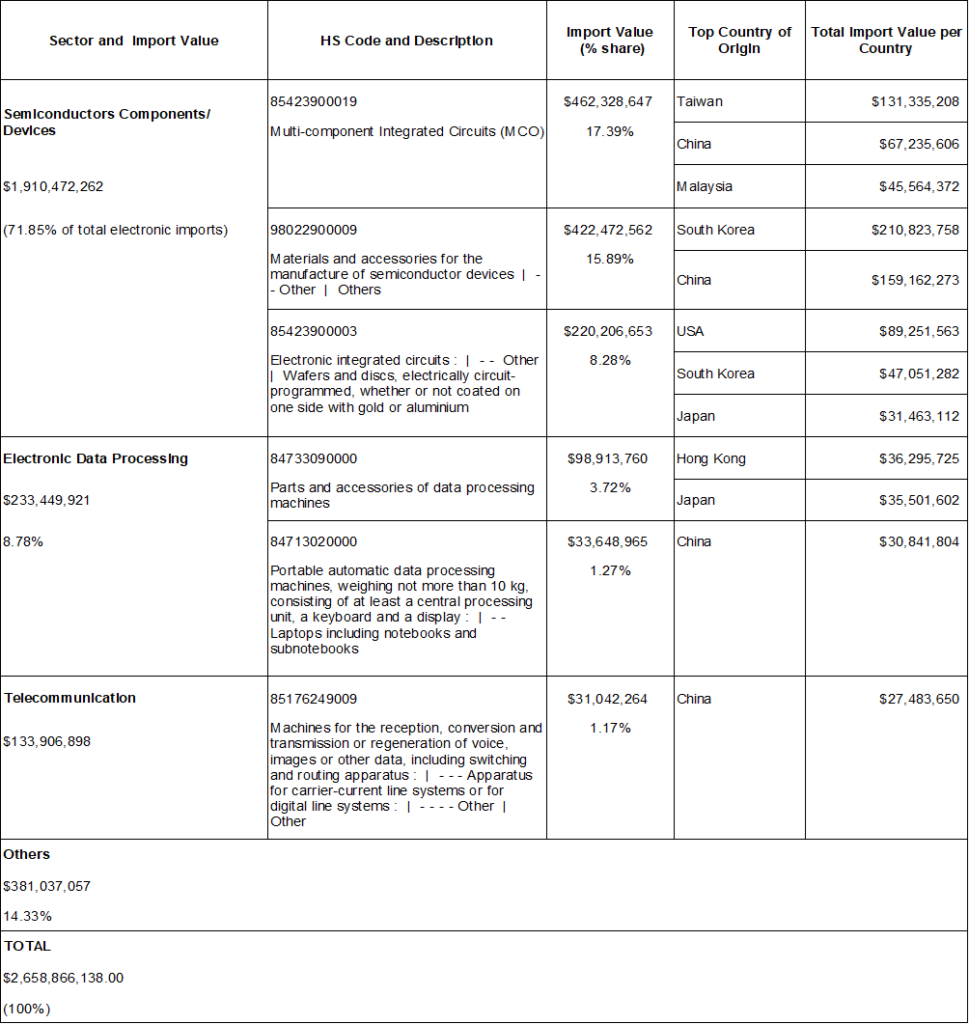
Fig. 4: Top Imported Products (December 2025)
Fig. 4 shows the top imported electronics products in December 2025. Parts and accessories of data processing machines under Electronic Data Processing imported from Japan rose by 22.22%. Meanwhile, Parts and accessories of data processing machines under Electronic Data Processing imported from China decreased by 37.49%. See Table 4.
Table 2: PH Electronics Imports Product by Sector (Month-on-Month and Year-on-Year)
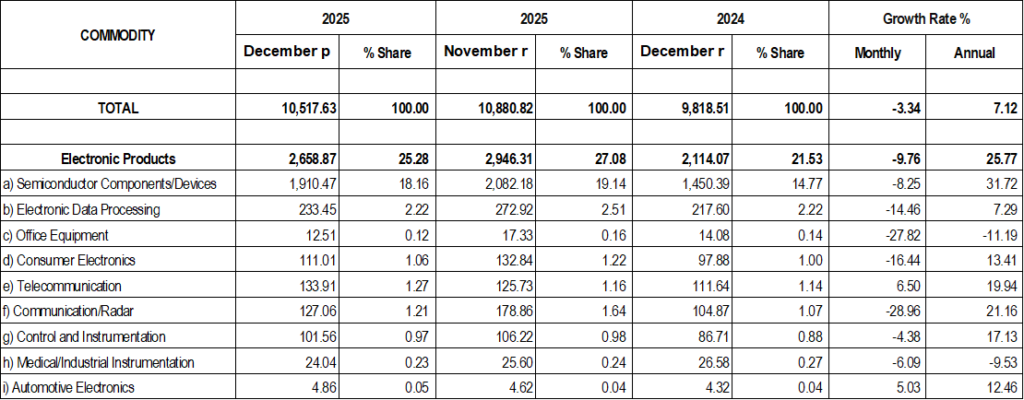
Table 3: PH Electronics Imports Product by Sector (Year-to-date)
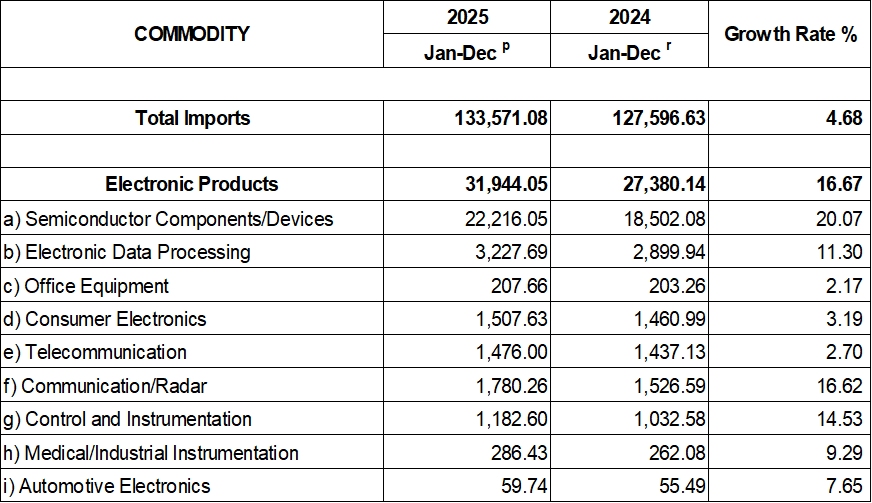
Table 4: PH Top Electronics Import Products and Countries of Destination