A. PH Electronics Exports: (Month-on-Month)
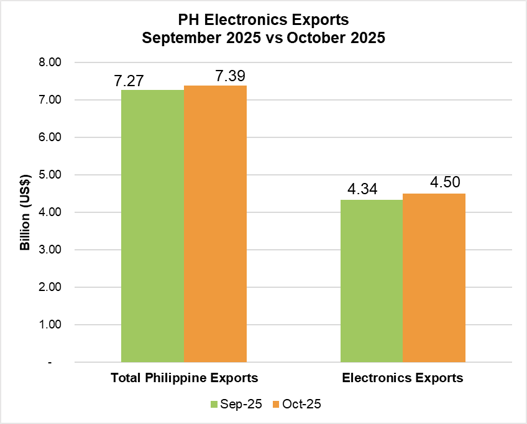
Fig. 1: PH Electronics Exports (September 2025 vs October 2025)
Electronics exports increased by 3.74% from US$ 4.34 billion in September 2025 to US$ 4.50 billion in October 2025, as shown in Fig. 1.
Exports in four (4) sectors improved as shown in Table 2. It was led by Telecommunication at 79.01%, from US$ 81.23 million to US$ 145.41 million, followed by Automotive Electronics (19.31%), Electronic Data Processing (8.85%), and Semiconductor Components/Devices (2.92%).
Meanwhile, Consumer Electronics contracted by 15.84%, from US$ 160.68 million to US$ 135.23 million. This was followed by Communication/Radar (15.60%), Medical/Industrial Office Equipment (11.85%), Control and Instrumentation (10.53%), Instrumentation (4.64%).
The Philippine Electronics exports grew by 38.19%, from US$ 3.26 billion in October 2024 to US$ 4.50 billion in October 2025, as shown in Fig. 2.
Exports in six (6) sectors increased, led by Semiconductor Components/Devices at 58.57%, from US$ 1.98 billion to US$ 3.14 billion. This was followed by Medical/Industrial Instrumentation (40.90%), Telecommunication (39.70%), Consumer Electronics (35.77%), Electronic Data Processing (14.63%), and Control and Instrumentation (3.48%). Kindly refer to Table 2.
Communication/Radar decreased by 67.08%, from US$ 50.39 million to US$ 16.59 million. It was followed by Office Equipment (19.36%), and Automotive Electronics (16.76%).
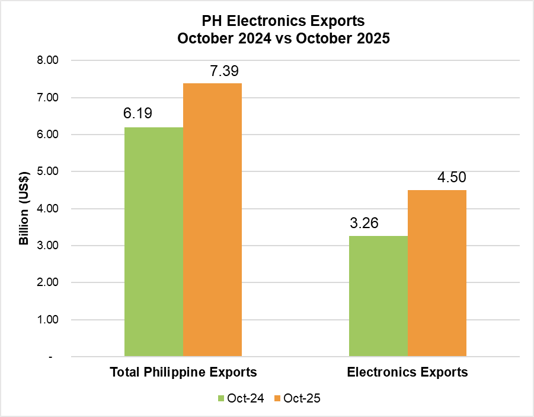
Fig. 2: PH Electronics Exports (October 2024 vs October 2025)
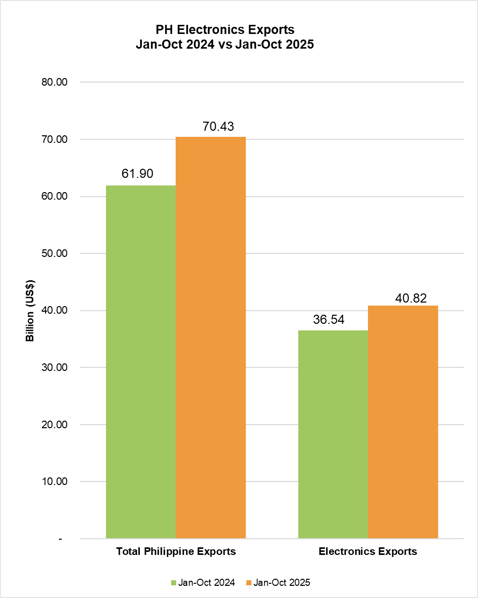
Fig. 3: PH Electronics Exports (January – October 2024 vs. January – October 2025)
Year-to-date electronics exports went up by 11.69%, from US$ 36.54 billion in 2024 to US$ 40.82 billion in 2025, which is equivalent to 57.95% of the total Philippine exports. Please see Fig. 3.
Exports from eight (8) sectors improved from last year’s YTD figures, led by Medical/Industrial Instrumentation at 49.09%, from US$ 312.58 million to US$ 466.04 million. It was followed by Automotive Electronics (27.76%), Office Equipment (26.65%), Telecommunication (21.24%), Control and Instrumentation (20.85%), Electronic Data Processing (16.12%), Consumer Electronics (14.96%), and Semiconductor Components/Devices (11.60%). Please see Table 3.
Meanwhile, Communication/Radar declined by 36.24%, from US$ 473.34 million to US$ 301.82 million.
COUNTRIES OF DESTINATION (OCTOBER 2025)
Table 1 shows the top five (5) export destinations in October 2025, namely, Hong Kong (16.34%), the USA (14.36%), China (10.31%), Singapore (6.61%), and Germany (6.51%).
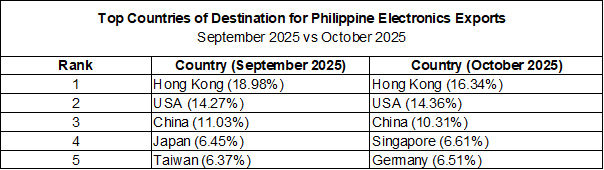
Table 1: Top 5 Destination Countries for Electronics Exports (September 2025 vs October 2025)
The other destinations in the top ten were Japan (6.37%), Taiwan (5.49%), Thailand (4.60%), the Netherlands (4.22%), and Malaysia (4.22%).
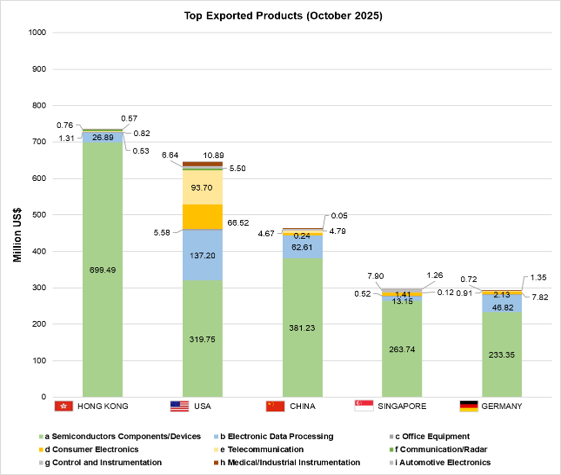
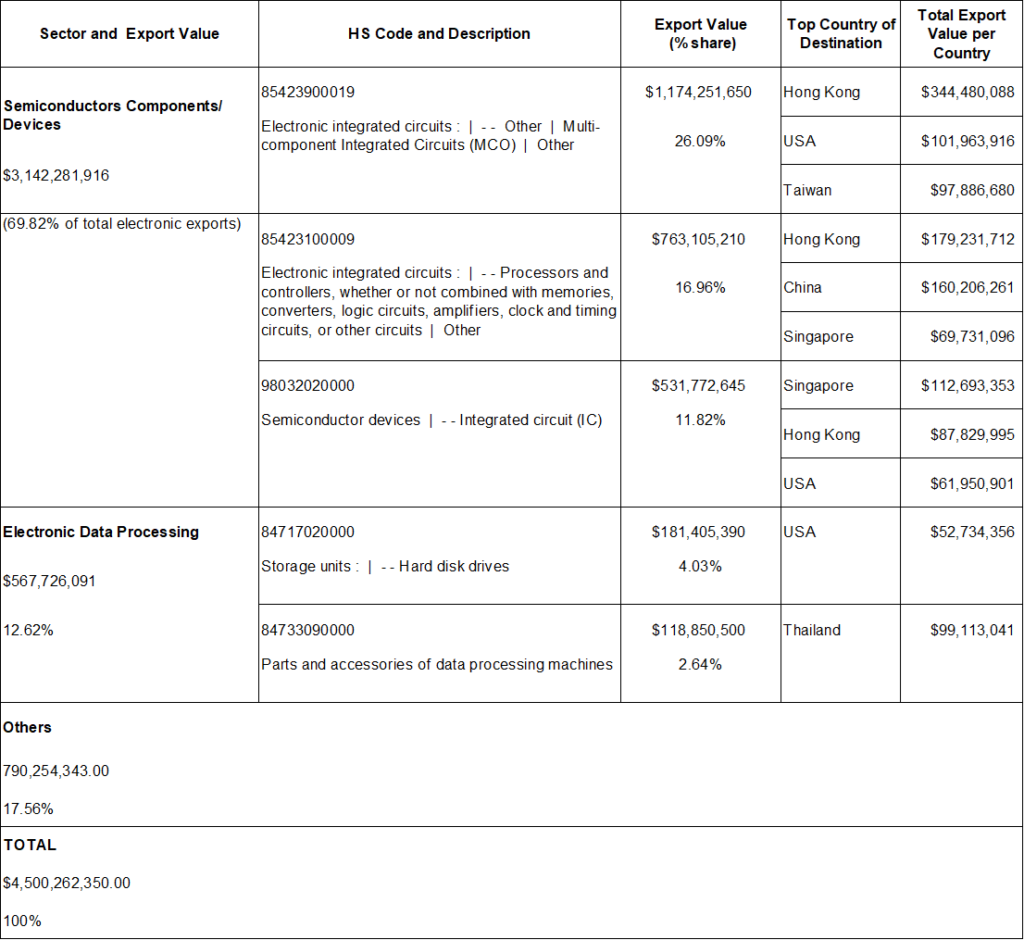
Fig. 4: Top Exported Products, October 2025
The top exported electronics products in October 2025 are in Fig. 4. Parts and accessories of data processing machines under Electronic Data Processing bound for Thailand rose by 47.09%. Meanwhile, Integrated Circuits bound for Hong Kong contracted by 44.32%. See Table 4.
Table 2: PH Electronics Exports Product by Sector (Month-on-Month and Year-on-Year)

Table 3: PH Top Electronics Export Products by Sector (Year-to-date)
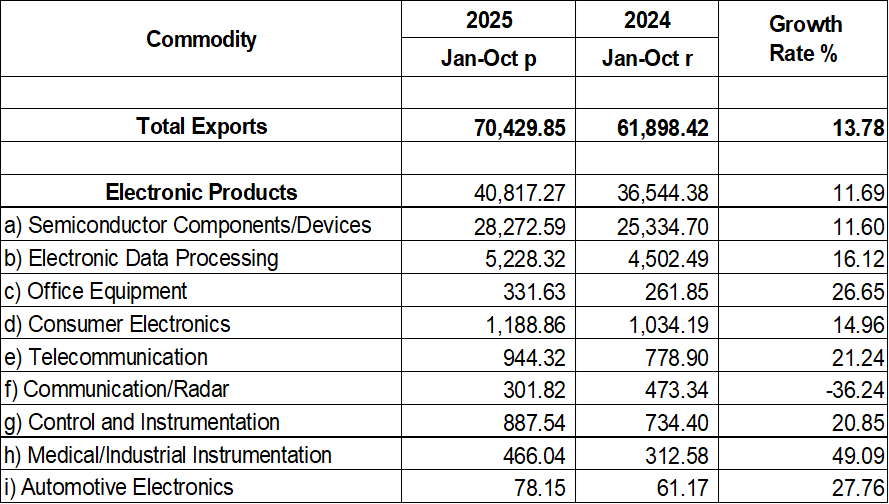
Table 4: PH Top Electronics Export Products and Countries of Destination