PHILIPPINE ELECTRONICS EXPORT PERFORMANCE NOVEMBER 2025
A. PH Electronics Exports: (Month-on-Month)
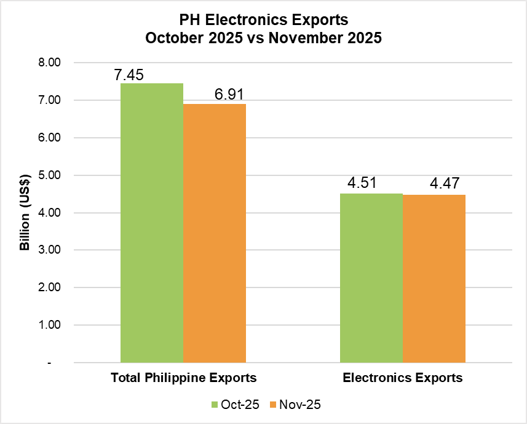
Fig. 1: PH Electronics Exports (October 2025 vs November 2025)
Electronics exports shrunk by 0.91% from US$ 4.51 billion in October 2025 to US$ 4.47 billion in November 2025, as shown in Fig. 1.
Exports in five (5) sectors declined as shown in Table 2. It was led by Telecommunication at 53.56%, from US$ 145.41 million to US$ 67.53 million, followed by Office Equipment (18.34%), Automotive Electronics (18.07%), Medical/Industrial Instrumentation (10.41%), and Control and Instrumentation (0.35%).
Communication/Radar increased by 6.09%, from US$ 16.63 million to US$ 44.96 million. This was followed by Electronic Data Processing (2.96%), Semiconductor Components/Devices (2.21%), and Consumer Electronics (1.62%).
The Philippine Electronics exports improved by 44.34%, from US$ 3.10 billion in November 2024 to US$ 4.47 billion in November 2025, as shown in Fig. 2.
Exports in five (5) sectors went up, led by Semiconductor Components/Devices at 69.26%, from US$ 1.91 billion to US$ 3.23 billion. It was followed by Electronic Data Processing (24.34%), Control and Instrumentation (19.66%), Medical/Industrial Instrumentation (14.20%), and Telecommunication (2.55%). Kindly refer to Table 2.
Meanwhile, Communication/Radar decreased by 63.42%, from US$ 48.24 million to US$ 17.65 million. This was followed by Office Equipment (27.34%), Automotive Electronics (25.90%), and Consumer Electronics (4.13%).
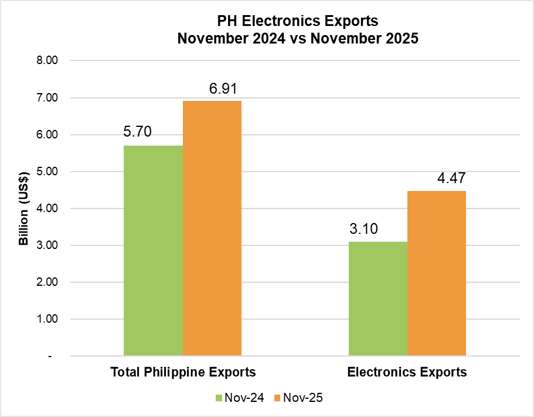
Fig. 2: PH Electronics Exports (November 2024 vs November 2025)
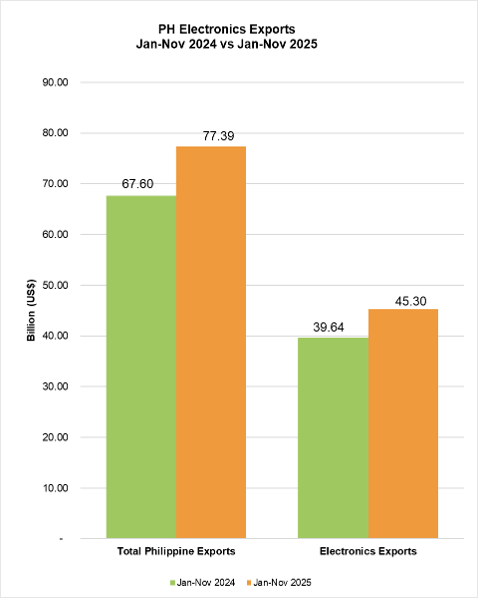
Fig. 3: PH Electronics Exports (January – November 2024 vs. January – November 2025)
Year-to-date electronics exports rose by 14.28%, from US$ 39.64 billion in 2024 to US$ 45.30 billion in 2025, which is equivalent to 58.54% of the total Philippine exports. Please see Fig. 3.
Exports from eight (8) sectors climbed from last year’s YTD figures, led by Medical/Industrial Instrumentation at 45.19%, from US$ 351.95 million to US$ 511.00 million. This was followed by Office Equipment (21.49%), Automotive Electronics (20.87%), Control and Instrumentation (20.74%), Telecommunication (19.78%), Electronic Data Processing (16.90%), Semiconductor Components/Devices (15.68%), and Consumer Electronics (12.63%). Please see Table 3.
Meanwhile, Communication/Radar decreased by 38.74%, from US$ 521.58 million to US$ 319.51 million.
COUNTRIES OF DESTINATION (NOVEMBER 2025)
Table 1 shows the top five (5) export destinations in November 2025, namely, Hong Kong (21.44%), the USA (15.42%), China (10.26%), Taiwan (6.33%), and Japan (5.80%).
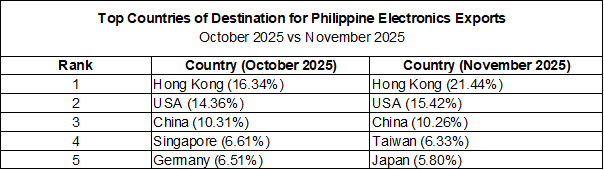
Table 1: Top 5 Destination Countries for Electronics Exports (October 2025 vs November 2025)
The other destinations in the top ten were Germany (5.59%), Singapore (5.53%), Thailand (4.46%), Malaysia (3.78%), and the Netherlands (3.56%).
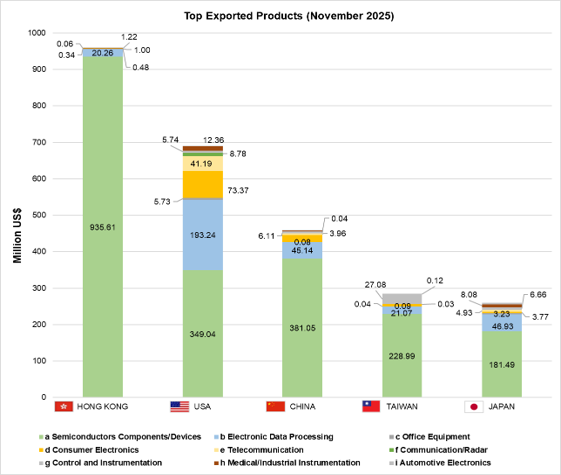
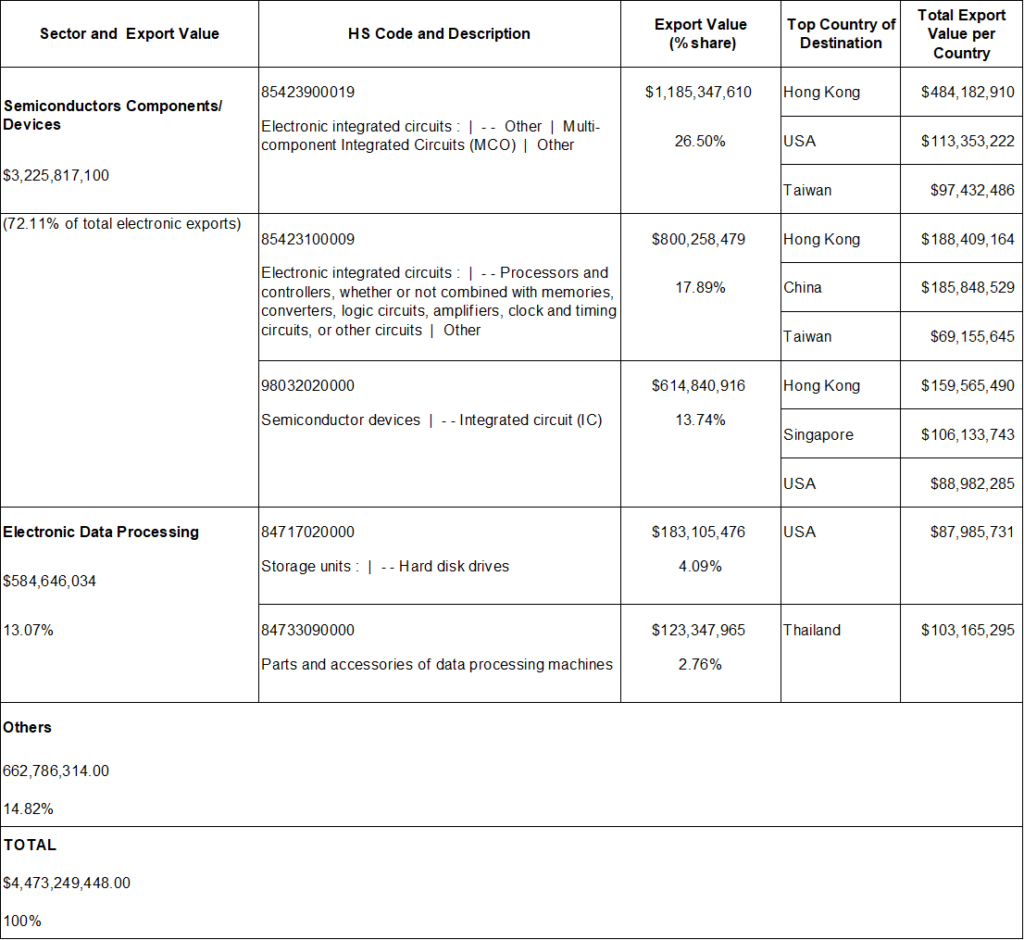
Fig. 4: Top Exported Products, November 2025
The top exported electronics products in November 2025 are in Fig. 4. Integrated Circuits bound for Hong Kong grew by 81.68%. Meanwhile, Integrated Circuits bound for Singapore shrunk by 5.82%. See Table 4.
Table 2: PH Electronics Exports Product by Sector (Month-on-Month and Year-on-Year)
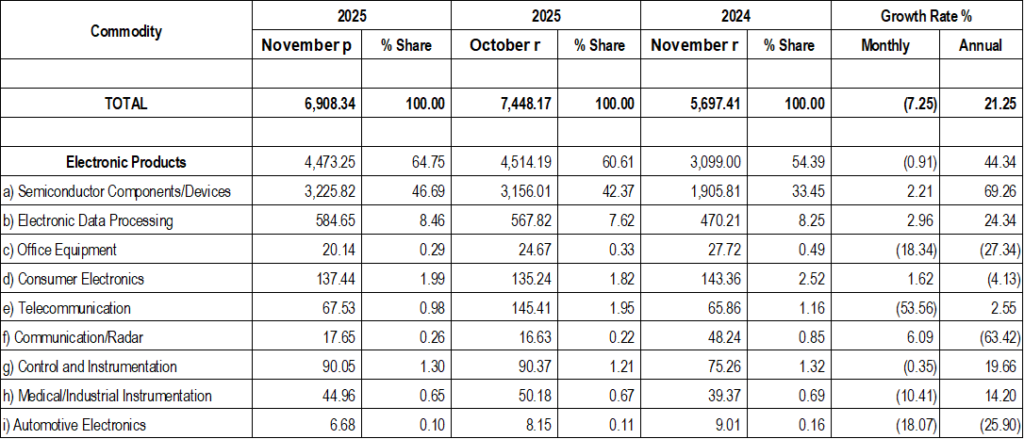
Table 3: PH Top Electronics Export Products by Sector (Year-to-date)
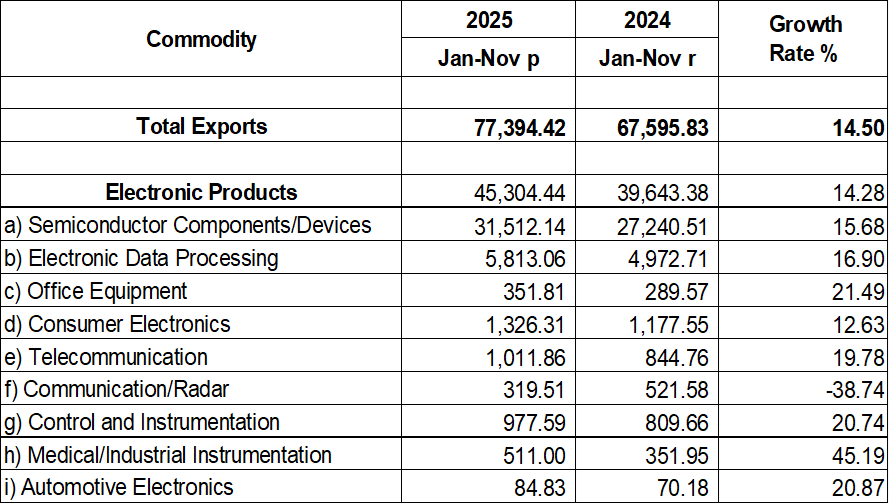
Table 4: PH Top Electronics Export Products and Countries of Destination