Electronics exports increased by 0.43% in June 2025 to US$ 4.20 billion, which is 59.85% of the US$ 7.02 billion total Philippine exports.
A.PH Electronics Exports: (Month-on-Month)
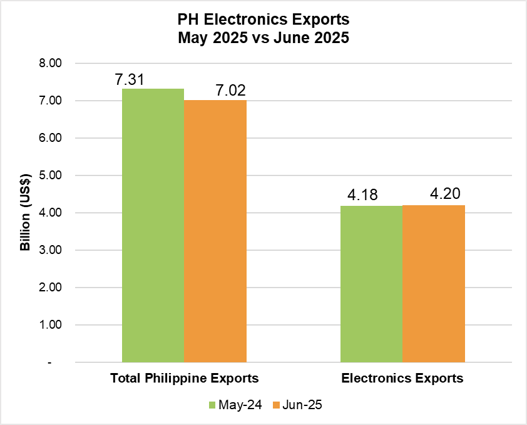
Fig. 1: PH Electronics Exports (May 2025 vs June 2025)
Electronics exports slightly improved by 0.43% from US$ 4.18 billion in May 2025 to US$ 4.20 billion in June 2025, as shown in Fig. 1.
Exports in four (4) sectors grew as shown in Table 2. It was led by Telecommunication at 32.70%, from US$ 92.14 million to US$ 122.27 million, followed by Consumer Electronics (14.48%), Office Equipment (8.28%), and Semiconductor Components/Devices (0.07%).
Communication/Radar declined by 11.15%, from US$ 25.10 million to US$ 22.30 million. It was followed by Medical/Industrial Instrumentation (9.46%), Automotive Electronics (2.60%), Control and Instrumentation (0.68%), and Electronic Data Processing (0.27%).
B. PH Electronics Exports: (Year-on-Year)
The Philippine Electronics exports climbed by 28.94%, from US$ 3.26 billion in June 2024 to US$ 4.20 billion in June 2025, as shown in Fig. 2.
Exports in eight (8) sectors increased, led by Telecommunication at 88.07%, from US$ 65.01 million to US$ 122.27 million. This was followed by Control and Instrumentation (56.37%), Electronic Data Processing (54.06%), Medical/Industrial Instrumentation (50.66%), Office Equipment (39.42%), Automotive Electronics (38.43%), Consumer Electronics (26.22%), and Semiconductor Components/Devices (24.65%). Kindly refer to Table 2.
Meanwhile, Communication/Radar shrunk by 33.56%, from US$ 33.57 million to US$ 22.30 million.
Fig. 2: PH Electronics Exports (June 2024 vs June 2025)
C. PH Electronics Exports (Year-to-Date)
Fig. 3: PH Electronics Exports (January –June 2024 vs. January –June 2025)
Year-to-date electronics exports grew by 5.45%, from US$ 22.34 billion in 2024 to US$ 23.56 billion in 2025, which is equivalent to 57.12% of the total Philippine exports. Please see Fig. 3.
Exports from eight (8) sectors improved from last year’s YTD figures, led by Medical/Industrial Instrumentation at 53.53%, from US$ 178.51 million to US$ 274.05 million. It was followed by Automotive Electronics (53.31%), Office Equipment (43.90%), Consumer Electronics (24.10%), Control and Instrumentation (22.10%), Telecommunication (21.47%), Electronic Data Processing (18.89%), and Semiconductor Components/Devices (0.78%). Please see Table 3.
Meanwhile, Communication/Radar contracted by 21.69%, from US$ 280.35 million to US$ 219.55 million.
COUNTRIES OF DESTINATION (JUNE 2025)
Table 1 shows the top five (5) export destinations in June 2025, namely, Hong Kong (19.61%), the USA (15.64%), China (8.58%), Singapore (6.63%), and Japan (6.57%). This was the same order for the countries of destination in May 2025.
Table 1: Top 5 Destination Countries for Electronics Exports (May 2025 vs June 2025)
The other destinations in the top ten were Germany (5.32%), Taiwan (5.12%), Thailand (4.07%), the Netherlands (3.79%), and South Korea (3.40%).
Fig. 4: Top Exported Products, June 2025
The top exported electronics products in June 2025 are in Fig. 4. Hard disk drives under Electronic Data Processing bound for the USA climbed by 24.74%. Meanwhile, Integrated Circuits bound for Taiwan declined by 23.92%. See Table 4.
Table 2: PH Electronics Exports Product by Sector (Month-on-Month and Year-on-Year)
Table 3: PH Top Electronics Export Products by Sector (Year-to-date)
Table 4: PH Top Electronics Export Products and Countries of Destination