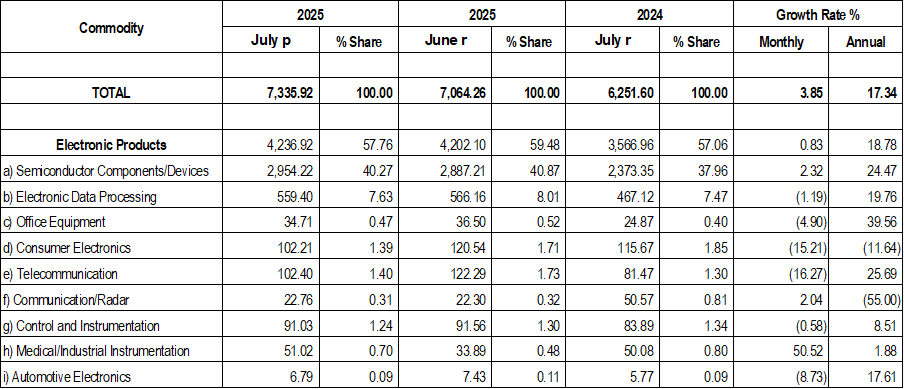
Electronics exports grew by 0.83% in July 2025 to US$ 4.24 billion, which is 57.76% of the US$ 7.34 billion total Philippine exports.
A.PH Electronics Exports: (Month-on-Month)
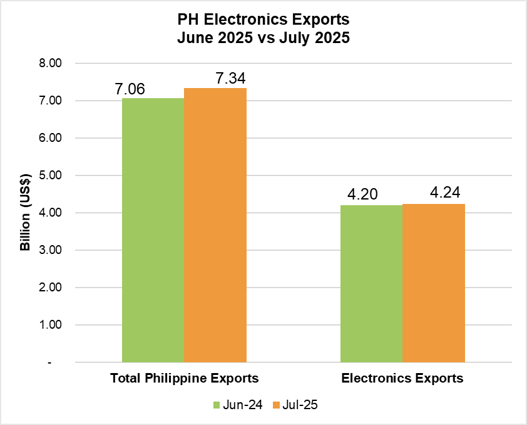
Fig. 1: PH Electronics Exports (June 2025 vs July 2025)
Electronics exports slightly increased by 0.83% from US$ 4.20 billion in June 2025 to US$ 4.24 billion in July 2025, as shown in Fig. 1.
Exports in three (3) sectors climbed as shown in Table 2. This was led by Medical/Industrial Instrumentation at 50.52%, from US$ 33.89 million to US$ 51.02 million, followed by Semiconductor Components/Devices (2.32%), and Communication/Radar (2.04%).
Meanwhile, Telecommunication contracted by 16.27%, from US$ 122.29 million to US$ 102.40 million. It was followed by Consumer Electronics (15.21%), Automotive Electronics (8.73%), Office Equipment (4.90%), Electronic Data Processing (1.19%), and Control and Instrumentation (0.58%).
B. PH Electronics Exports: (Year-on-Year)
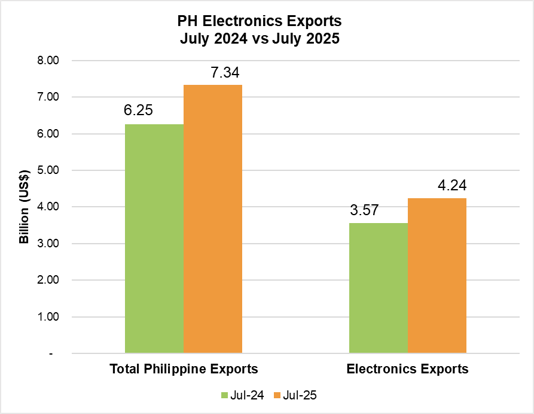
The Philippine Electronics exports increased by 18.78%, from US$ 3.57 billion in July 2024 to US$ 4.24 billion in July 2025, as shown in Fig. 2.
Exports in seven (7) sectors went up, led by Office Equipment at 39.56%, from US$ 24.87 million to US$ 34.71 million. It was followed by Telecommunication (25.69%), Semiconductor Components/Devices (24.47%), Electronic Data Processing (19.76%), Automotive Electronics (17.61%), Control and Instrumentation (8.51%), and Medical/Industrial Instrumentation (1.88%). Kindly refer to Table 2.
Communication/Radar declined by 55.00%, from US$ 50.57 million to US$ 22.76 million. This was followed by Consumer Electronics (11.64%).
Fig. 2: PH Electronics Exports (July 2024 vs July 2025)
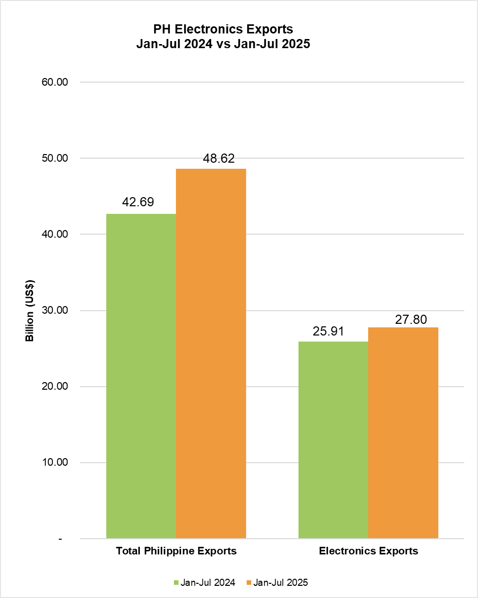
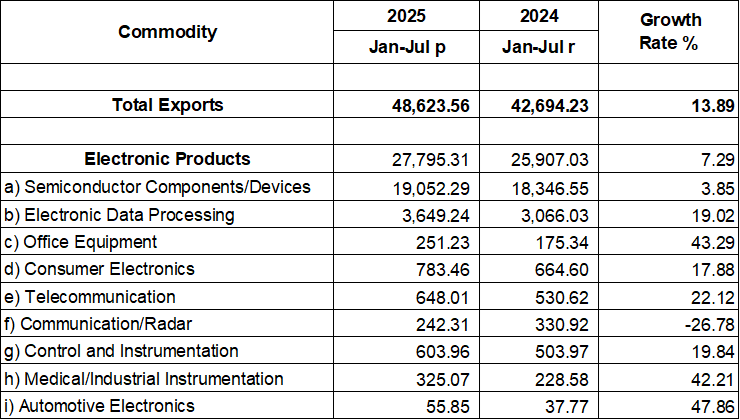
Year-to-date electronics exports improved by 7.29%, from US$ 25.91 billion in 2024 to US$ 27.78 billion in 2025, which is equivalent to 57.16% of the total Philippine exports. Please see Fig. 3.
Exports from eight (8) sectors climbed from last year’s YTD figures, led by Automotive Electronics at 47.86%, from US$ 37.77 million to US$ 55.85 million. It was followed by Office Equipment (43.29%), Medical/Industrial Instrumentation (42.21%), Telecommunication (22.12%), Control and Instrumentation (19.84%), Electronic Data Processing (19.02%), Consumer Electronics (17.88%), and Semiconductor Components/Devices (3.85%). Please see Table 3.
Meanwhile, Communication/Radar shrunk by 26.78%, from US$ 330.92 million to US$ 242.31 million.
COUNTRIES OF DESTINATION (JULY 2025)
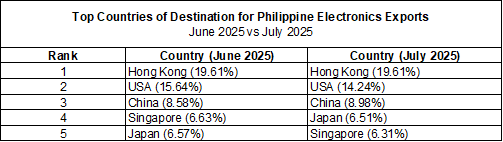
Table 1 shows the top five (5) export destinations in July 2025, namely, Hong Kong (19.61%), the USA (14.24%), China (8.98%), Japan (6.51%), and Singapore (6.31%).
Table 1: Top 5 Destination Countries for Electronics Exports (June 2025 vs July 2025)
The other destinations in the top ten were Taiwan (5.94%), Germany (5.86%), Thailand (4.19%), the Netherlands (3.69%), and South Korea (3.67%).
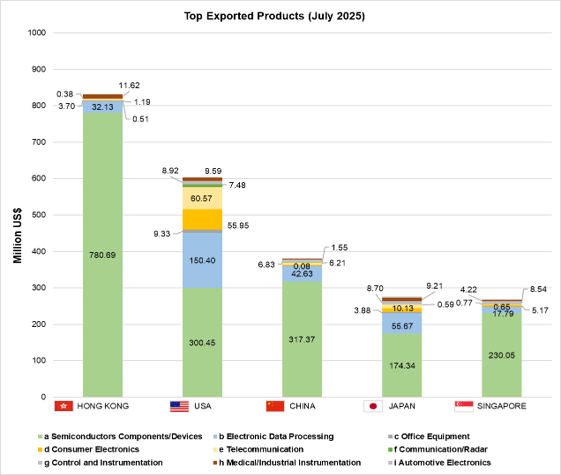
Fig. 4: Top Exported Products, July 2025
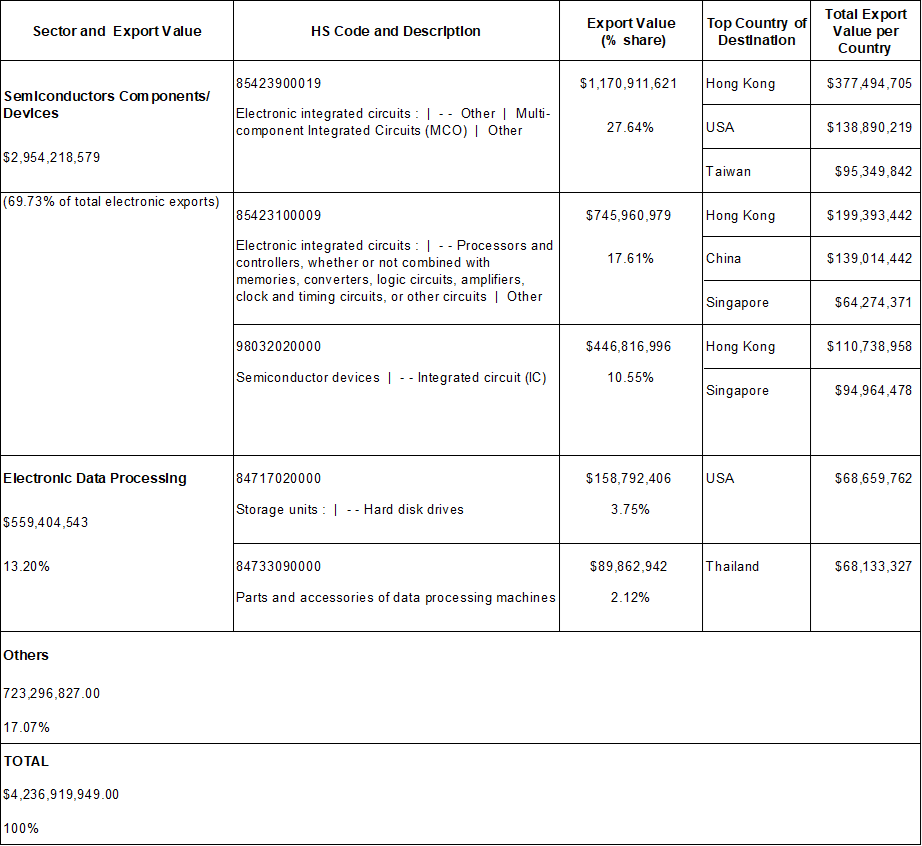
The top exported electronics products in July 2025 are in Fig. 4. Multi-component Integrated Circuits (MCO) bound for the USA grew by 31.84%. Meanwhile, Integrated Circuits bound for Hong Kong contracted by 16.99%. See Table 4.
Table 2: PH Electronics Exports Product by Sector (Month-on-Month and Year-on-Year)
Table 3: PH Top Electronics Export Products by Sector (Year-to-date)
Table 4: PH Top Electronics Export Products and Countries of Destination