Electronics exports grew by 3.69% in September 2025 to US$ 4.34 billion, which is 59.81% of the US$ 7.25 billion total Philippine exports.
A.PH Electronics Exports: (Month-on-Month)
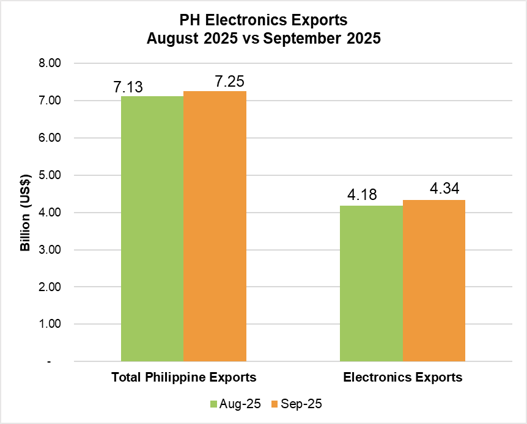
Fig. 1: PH Electronics Exports (August 2025 vs September 2025)
Electronics exports improved by 3.69 % from US$ 4.18 billion in August 2025 to US$ 4.34 billion in September 2025, as shown in Fig. 1.
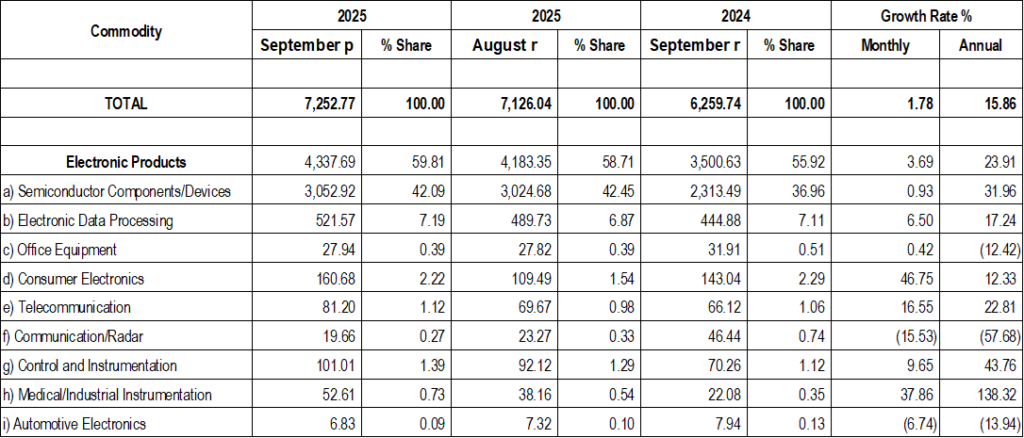
Exports in seven (7) sectors went up as shown in Table 2. This was led by Consumer Electronics at 46.75%, from US$ 109.49 million to US$ 160.68 million, followed by Medical/Industrial Instrumentation (37.86%), Telecommunication (16.55%), Control and Instrumentation (9.65%), Electronic Data Processing (6.50%), Semiconductor Components/Devices (0.93%), and Office Equipment (0.42%).
Meanwhile, Communication/Radar declined by 15.53%, from US$ 23.27 million to US$ 19.66 million. It was followed by Automotive Electronics (6.74%).
B. PH Electronics Exports: (Year-on-Year)
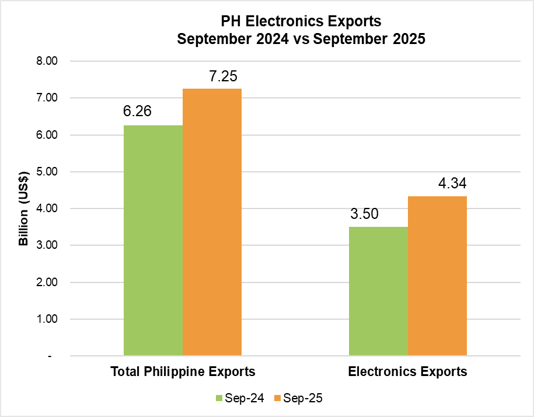
The Philippine Electronics exports climbed by 23.91%, from US$ 3.50 billion in September 2024 to US$ 4.34 billion in September 2025, as shown in Fig. 2.
Exports in six (6) sectors increased, led by Medical/Industrial Instrumentation at 138.32%, from US$ 22.08 million to US$ 52.61 million. It was followed by Control and Instrumentation (43.76%), Semiconductor Components/Devices (31.96%), Telecommunication (22.81%), Electronic Data Processing (17.24%), and Consumer Electronics (12.33%). Kindly refer to Table 2.
Communication/Radar decreased by 57.68%, from US$ 46.44 million to US$ 19.66 million. This was followed by Automotive Electronics (13.94%), and Office Equipment (12.42%).
Fig. 2: PH Electronics Exports (September 2024 vs September 2025)
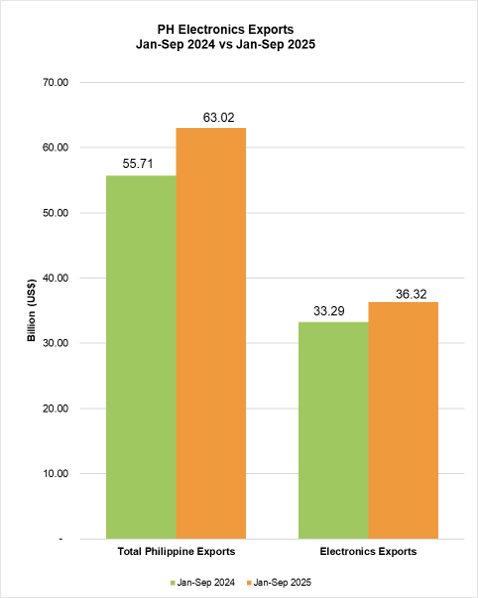
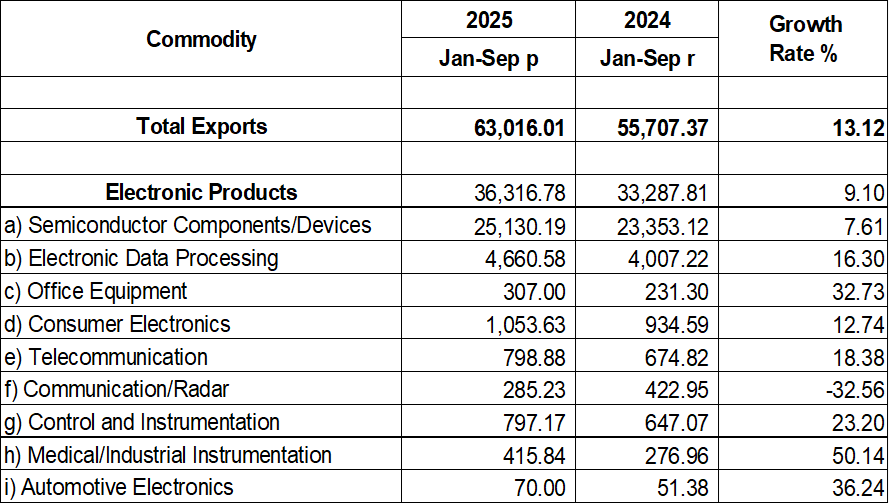
Year-to-date electronics exports rose by 9.10%, from US$ 33.29 billion in 2024 to US$ 36.32 billion in 2025, which is equivalent to 57.63% of the total Philippine exports. Please see Fig. 3.
Exports from eight (8) sectors increased from last year’s YTD figures, led by Medical/Industrial Instrumentation at 50.14%, from US$ 276.96 million to US$ 415.84 million. It was followed by Automotive Electronics (36.24%), Office Equipment (32.73%), Control and Instrumentation (23.20%), Telecommunication (18.38%), Electronic Data Processing (16.30%), Consumer Electronics (12.74%), and Semiconductor Components/Devices (7.61%). Please see Table 3.
Meanwhile, Communication/Radar went down by 32.56%, from US$ 422.95 million to US$ 285.23 million.
COUNTRIES OF DESTINATION (SEPTEMBER 2025)
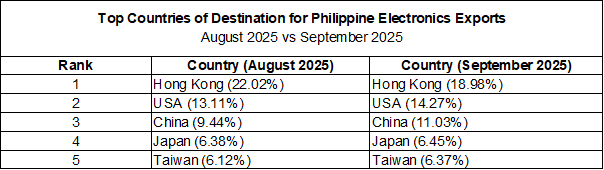
Table 1 shows the top five (5) export destinations in September 2025, namely, Hong Kong (18.98%), the USA (14.27%), China (11.03%), Japan (6.45%), and Taiwan (6.37%). This was the same order for the countries of destination in August 2025.
Table 1: Top 5 Destination Countries for Electronics Exports (August 2025 vs September 2025)
The other destinations in the top ten were Germany (5.77%), Singapore (5.75%), Thailand (3.58%), Malaysia (3.35%), and South Korea (3.05%).
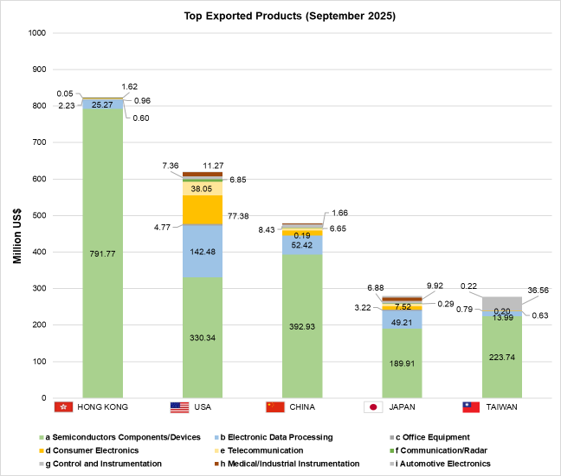
Fig. 4: Top Exported Products, September 2025
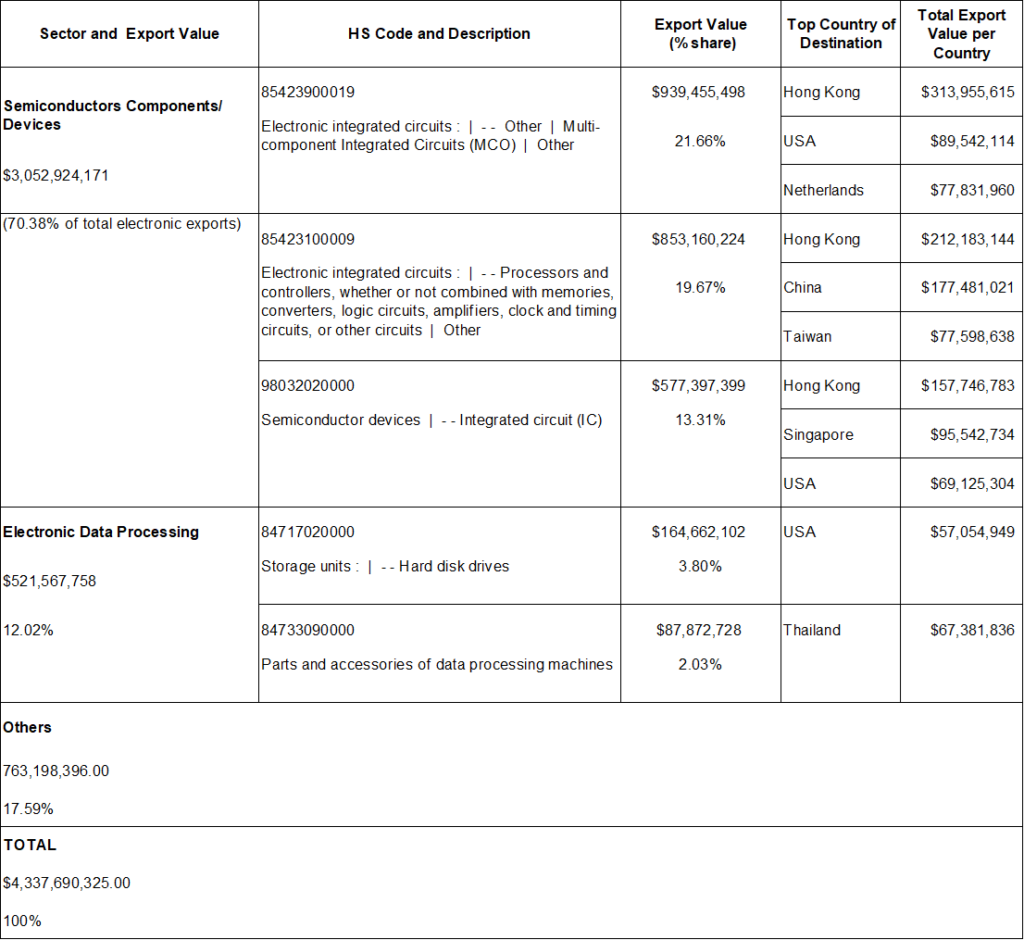
The top exported electronics products in September 2025 are in Fig. 4. Electronic Integrated Circuits – Processors and Controllers bound for China grew by 14.34%. Meanwhile, Multi-component Integrated Circuits (MCO) bound for the Netherlands shrunk by 24.55%. See Table 4.
Table 2: PH Electronics Exports Product by Sector (Month-on-Month and Year-on-Year)
Table 3: PH Top Electronics Export Products by Sector (Year-to-date)
Table 4: PH Top Electronics Export Products and Countries of Destination