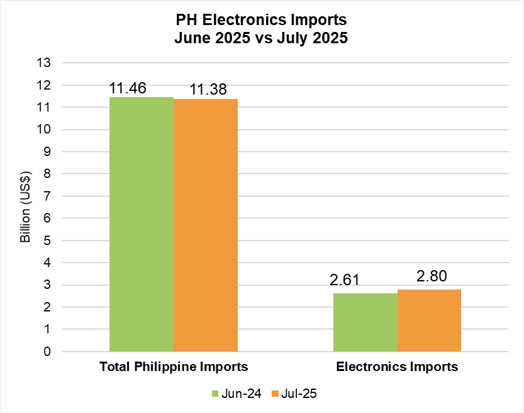
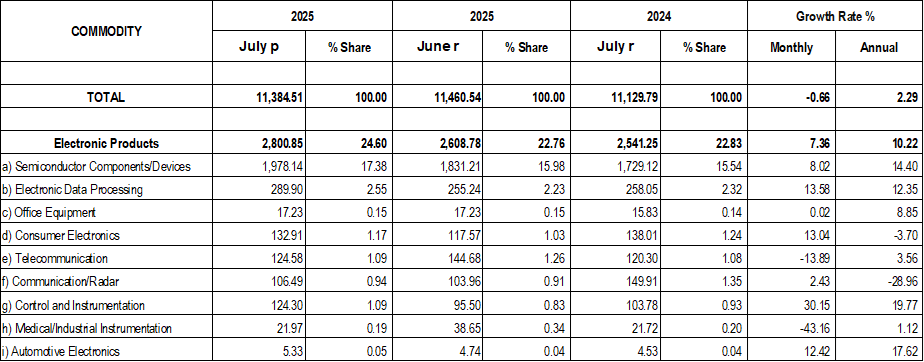
Electronics imports in July 2025 increased by 7.36% from US$ 2.61 billion in June 2025 to US$ 2.80 billion, which is 24.60% of the country’s US$ 11.38 billion total commodity imports.
A.PH Electronics Imports: (Month-on-Month)
Fig. 1: PH Electronics Imports (June 2025 vs July 2025)
The country’s electronics imports climbed by 7.36% from US$ 2.61 billion in June 2025 to US$ 2.80 billion in July 2025. See Fig. 1.
Seven (7) electronics sectors grew, led by Control and Instrumentation at 30.15%, from US$ 95.50 million to US$ 124.30 million. This was followed by Electronic Data Processing (13.58%), Consumer Electronics (13.04%), Automotive Electronics (12.42%), Semiconductor Components/Devices (8.02%), Communication/Radar (2.43%), and Office Equipment (0.02%).
Meanwhile, Medical/Industrial Instrumentation shrunk by 43.16%, from US$ 38.65 million to US$ 21.97 million. It was followed by Telecommunication (13.89%).
B. PH Electronics Imports: (Year-on-Year)
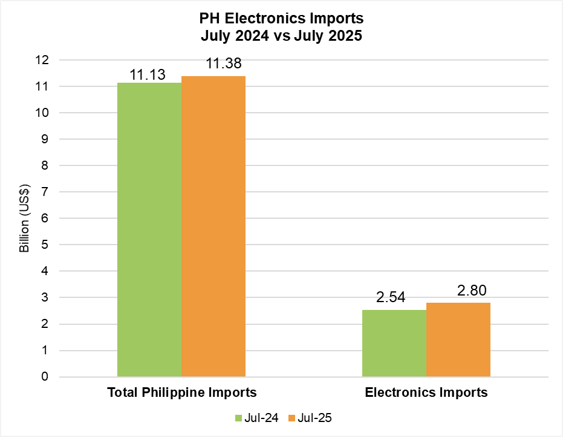
The electronics imports rose by 10.22%, from US$ 2.54 billion in July 2024 to US$ 2.80 billion in July 2025, as shown in Fig. 2.
Seven (7) sectors went up, which was led by Control and Instrumentation at 19.77%, from US$ 103.78 million to US$ 124.30 million, as shown in Table 2. This was followed by Automotive Electronics (17.62%), Semiconductor Components/Devices (14.40%), Electronic Data Processing (12.35%), Office Equipment (8.85%), Telecommunication (3.56%), and Medical/Industrial Instrumentation (1.12%).
Two (2) sectors contracted, namely, Communication/Radar (28.96%), and Consumer Electronics (3.70%).
Fig. 2: PH Electronics Imports (July 2024 vs July 2025)
C. PH Electronics Imports (Year-to-Date)
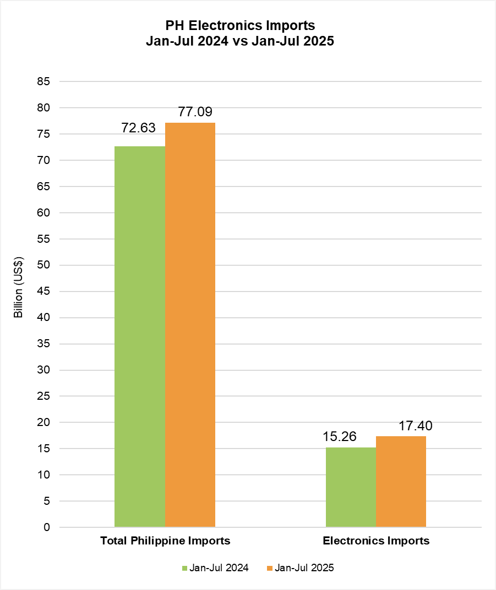
Fig. 3: PH Electronics Exports (January – July 2024 vs. January – July 2025)
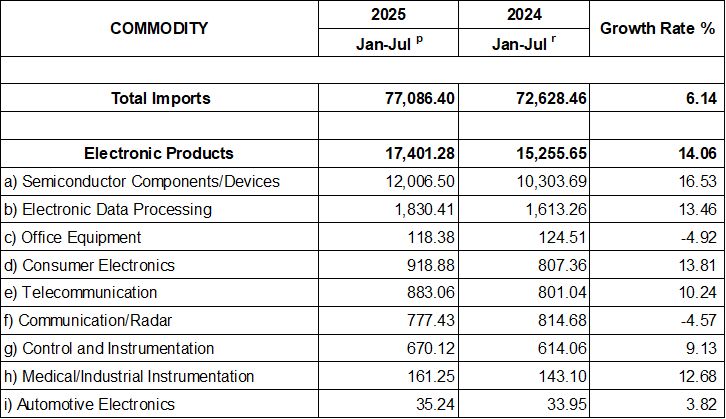
Cumulative electronics imports grew by 14.06%, from US$ 15.26 billion in 2024 to US$ 17.40 billion in 2025. These comprised 22.57% of the total Philippine commodity imports YTD (See Fig. 3).
Seven (7) electronics sectors increased, led by Semiconductor Components/Devices at 16.53%, from US$ 10.30 billion to US$ 12.00 billion. This was followed by Consumer Electronics (13.81%), Electronic Data Processing (13.46%), Medical/Industrial Instrumentation (12.68%), Telecommunication (10.24%), Control and Instrumentation (9.13%), and Automotive Electronics (3.82%). Kindly refer to Table 3.
Meanwhile, Office Equipment declined by 4.92%, from US$ 124.51 million to US$ 118.38 million. It was followed by Communication/Radar (4.57 %).
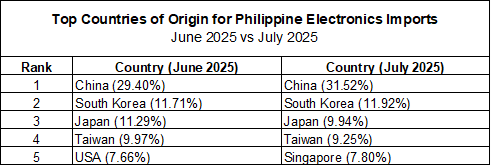
COUNTRIES OF ORIGIN (JULY 2025)
Table 1 shows that the top five (5) countries of origin of electronics imports in July 2025 were China (31.52%), South Korea (11.92%), Japan (9.94%), Taiwan (9.25%), and Singapore (7.80%).
Table 1: Top 5 Countries of Origin for Electronics Imports (June 2025 vs July 2025)
The rest of the top ten countries of origin were the USA (7.61%), Hong Kong (5.36%), Malaysia (4.10%), Thailand (2.62%), and Vietnam (2.48%).
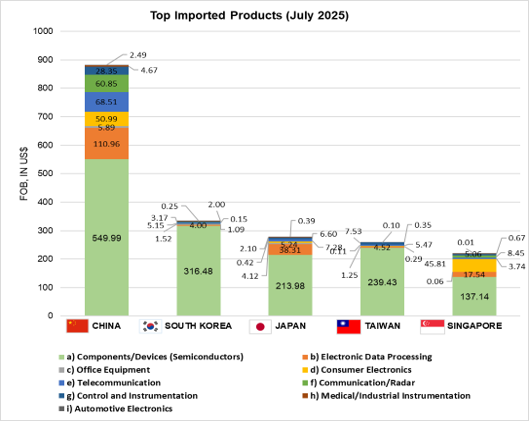
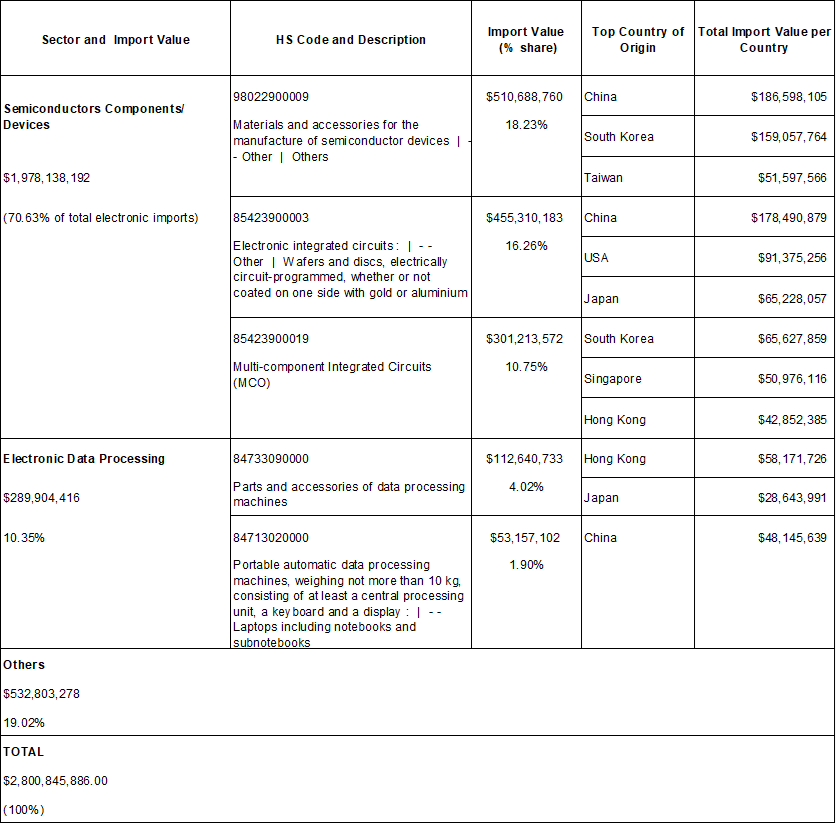
Fig. 4: Top Imported Products (July 2025)
Fig. 4 shows the top imported electronics products in July 2025. Electronic Integrated Circuits – wafers and discs imported from China increased by 440.92%. Meanwhile, Multi-component Integrated Circuits (MCO) imported from Hong Kong declined by 29.37%. See Table 4.
Table 2: PH
Electronics Imports Product by Sector (Month-on-Month and Year-on-Year)
Table 3: PH Electronics Imports Product by Sector (Year-to-date)
Table 4: PH Top Electronics Import Products and Countries of Destination