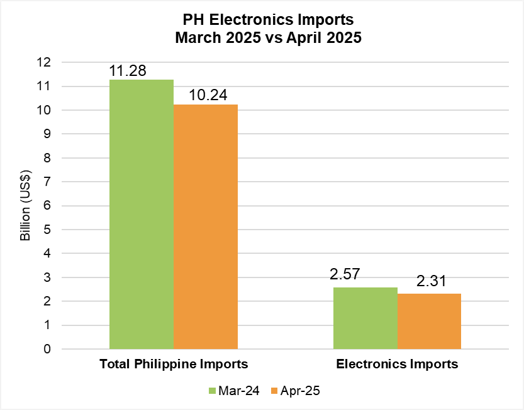
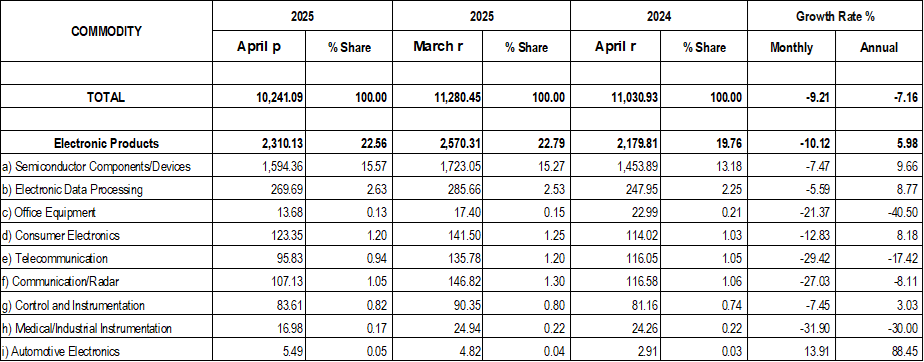
Electronics imports in April 2025 decreased by 10.12% from US$ 2.57 billion in March 2025 to US$ 2.31 billion, which is 22.56% of the country’s US$ 10.24 billion total commodity imports.
A. PH Electronics Imports: (Month-on-Month)
Fig. 1: PH Electronics Imports (March 2025 vs April 2025)
The country’s electronics imports declined by 10.12% from US$ 2.57 billion in March 2025 to US$ 2.31 billion in April 2025. See Fig. 1.
Eight (8) electronics sectors shrunk, led by Medical/Industrial Instrumentation at 31.90%, from US$ 24.94 million to US$ 16.98 million. It was followed by Telecommunication (29.42%), Communication/Radar (27.03%), Office Equipment (21.37%), Consumer Electronics (12.83%), Semiconductor Components/Devices (7.47%), Control and Instrumentation (7.45%), and Electronic Data Processing (5.59%).
Meanwhile, Automotive Electronics grew by 13.91%, from US$ 4.82 million to US$ 5.49 million.
B. PH Electronics Imports: (Year-on-Year)
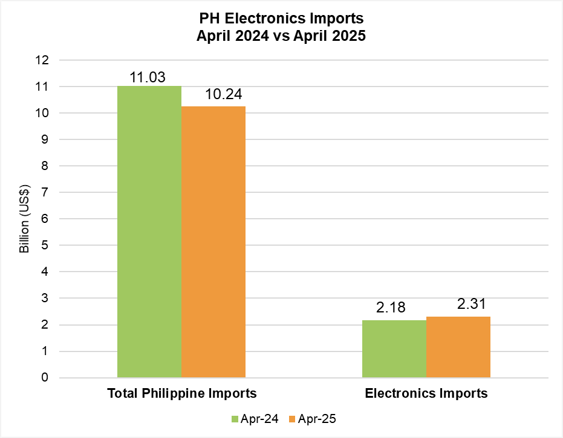
The electronics imports climbed by 5.98%, from US$ 2.18 billion in April 2024 to US$ 2.31 billion in April 2025, as shown in Fig. 2.
Five (5) sectors increased, which was led by Automotive Electronics at 88.45%, from US$ 2.91 million to US$ 5.49 million, as shown in Table 2. This was followed by Semiconductor Components/Devices (9.66%), Electronic Data Processing (8.77%), Consumer Electronics (8.18%), and Control and Instrumentation (3.03%).
Four (4) sectors went down, namely, Office Equipment (40.50%), Medical/Industrial Instrumentation (30.00%), Telecommunication (17.42%), and Communication/Radar (8.11%).
Fig. 2: PH Electronics Imports (April 2024 vs April 2025)
C. PH Electronics Imports (Year-to-Date)
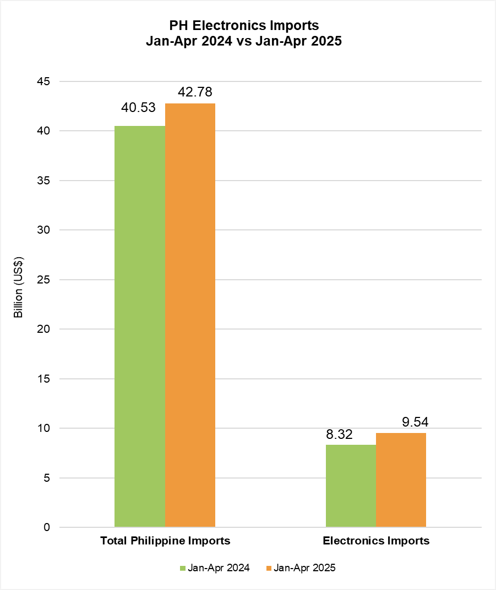
Fig. 3: PH Electronics Exports (January – April 2024 vs. January – April 2025)
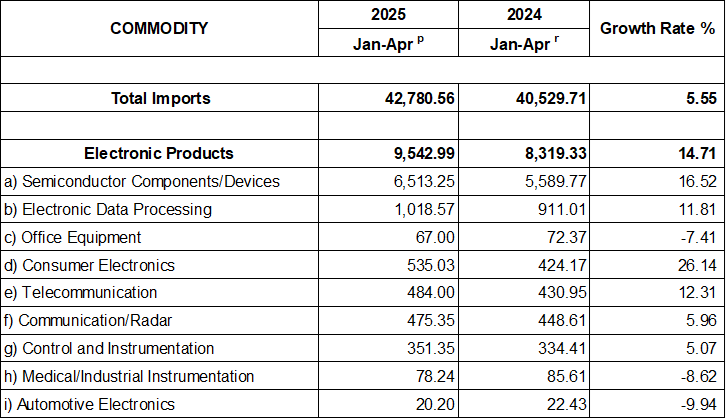
Cumulative electronics imports went up by 14.71%, from US$ 8.32 billion in 2024 to US$ 9.54 billion in 2025. These comprised 22.31% of the total Philippine commodity imports YTD (See Fig. 3).
Six (6) electronics sectors grew, led by Consumer Electronics at 26.14%, from US$ 424.17 million to US$ 535.03 million. This was followed by Semiconductor Components/Devices (16.52%), Telecommunication (12.31%), Electronic Data Processing (11.81%), Communication/Radar (5.96%), and Control and Instrumentation (5.07%). Kindly refer to Table 3.
Meanwhile, Automotive Electronics contracted by 9.94%, from US$ 22.43 million to US$ 20.20 million. It was followed by Medical/Industrial Instrumentation (8.62%), and Office Equipment (7.41%).
COUNTRIES OF ORIGIN (APRIL 2025)
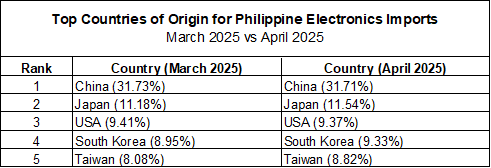
Table 1 shows that the top five (5) countries of origin of electronics imports in April 2025 were China (31.71%), Japan (11.54%), the USA (9.37%), South Korea (9.33%), and Taiwan (8.82%). These were likewise the countries of origin in the same order in March 2025.
Table 1: Top 5 Countries of Origin for Electronics Imports (March 2025 vs April 2025)
The rest of the top ten countries of origin were Singapore (7.42%), Hong Kong (4.53%), Malaysia (3.77%), Vietnam (3.11%), and Thailand (3.03%).
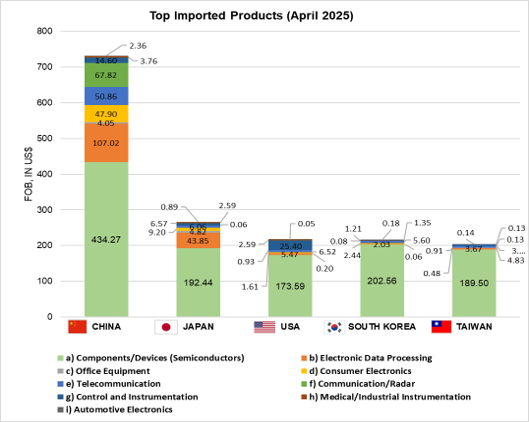
Fig. 4: Top Imported Products (April 2025)
Fig. 4 shows the top imported electronics products in April 2025. Parts and accessories of data processing machines under electronic data processing imported from Japan climbed by 19.03%. Meanwhile, Materials and accessories for the manufacture of semiconductor devices imported from Taiwan shrunk by 7.30%. See Table 3
Table 2: PH
Electronics Imports Product by Sector (Month-on-Month and Year-on-Year)
Table 3: PH Electronics Imports Product by Sector (Year-to-date)
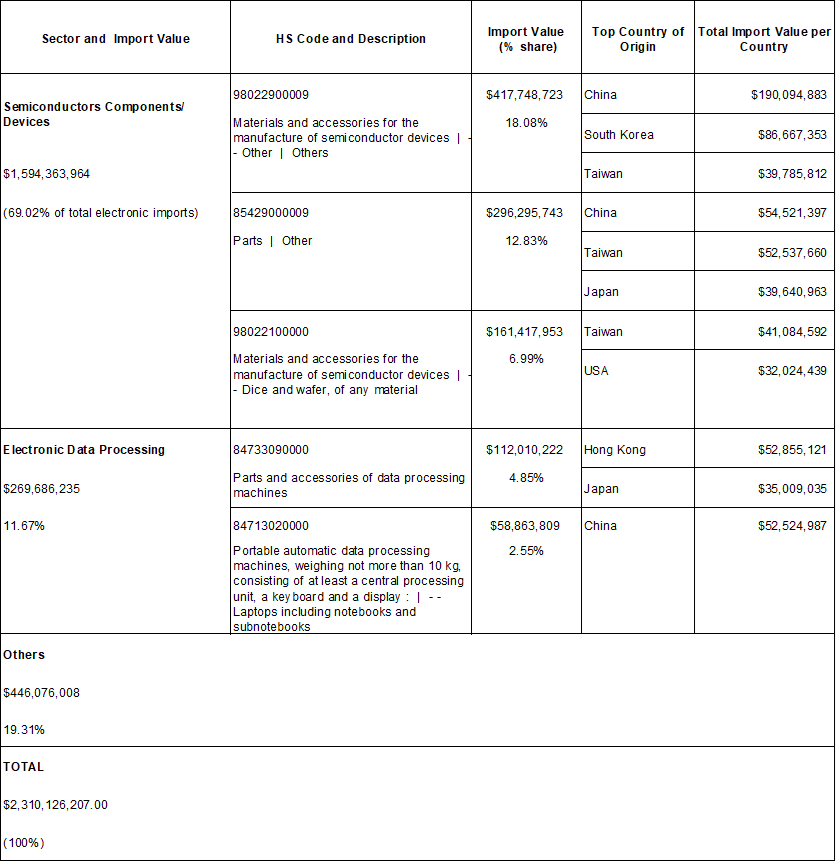
Table 4: PH Top Electronics Import Products and Countries of Destination